Plots
When your R code generates a graphic, the app captures it and saves it to the Plots gallery automatically.
Plot Capture
Plot capture works with R’s built-in plotting functions and any package that uses the standard graphics system. Each line below draws one plot, and all four land in the gallery:
# Any of these will create a plot that appears in the gallery
plot(1:10, sin(1:10), type = "l", main = "Sine Wave")
hist(rnorm(100), main = "Normal Distribution")
barplot(table(sample(letters[1:5], 50, replace = TRUE)))
boxplot(mpg ~ cyl, data = mtcars)
No need for dev.off(). Run your code and switch to the Plots tab, where plots arrive in the order R drew them. A badge on Plots counts every plot and widget made since you last looked.
To see each plot in the Console too, under the command that drew it, set Settings > Appearance > New Plots to Gallery and Console, or turn on Inline Plots in the Console’s … menu.
The Plot Gallery
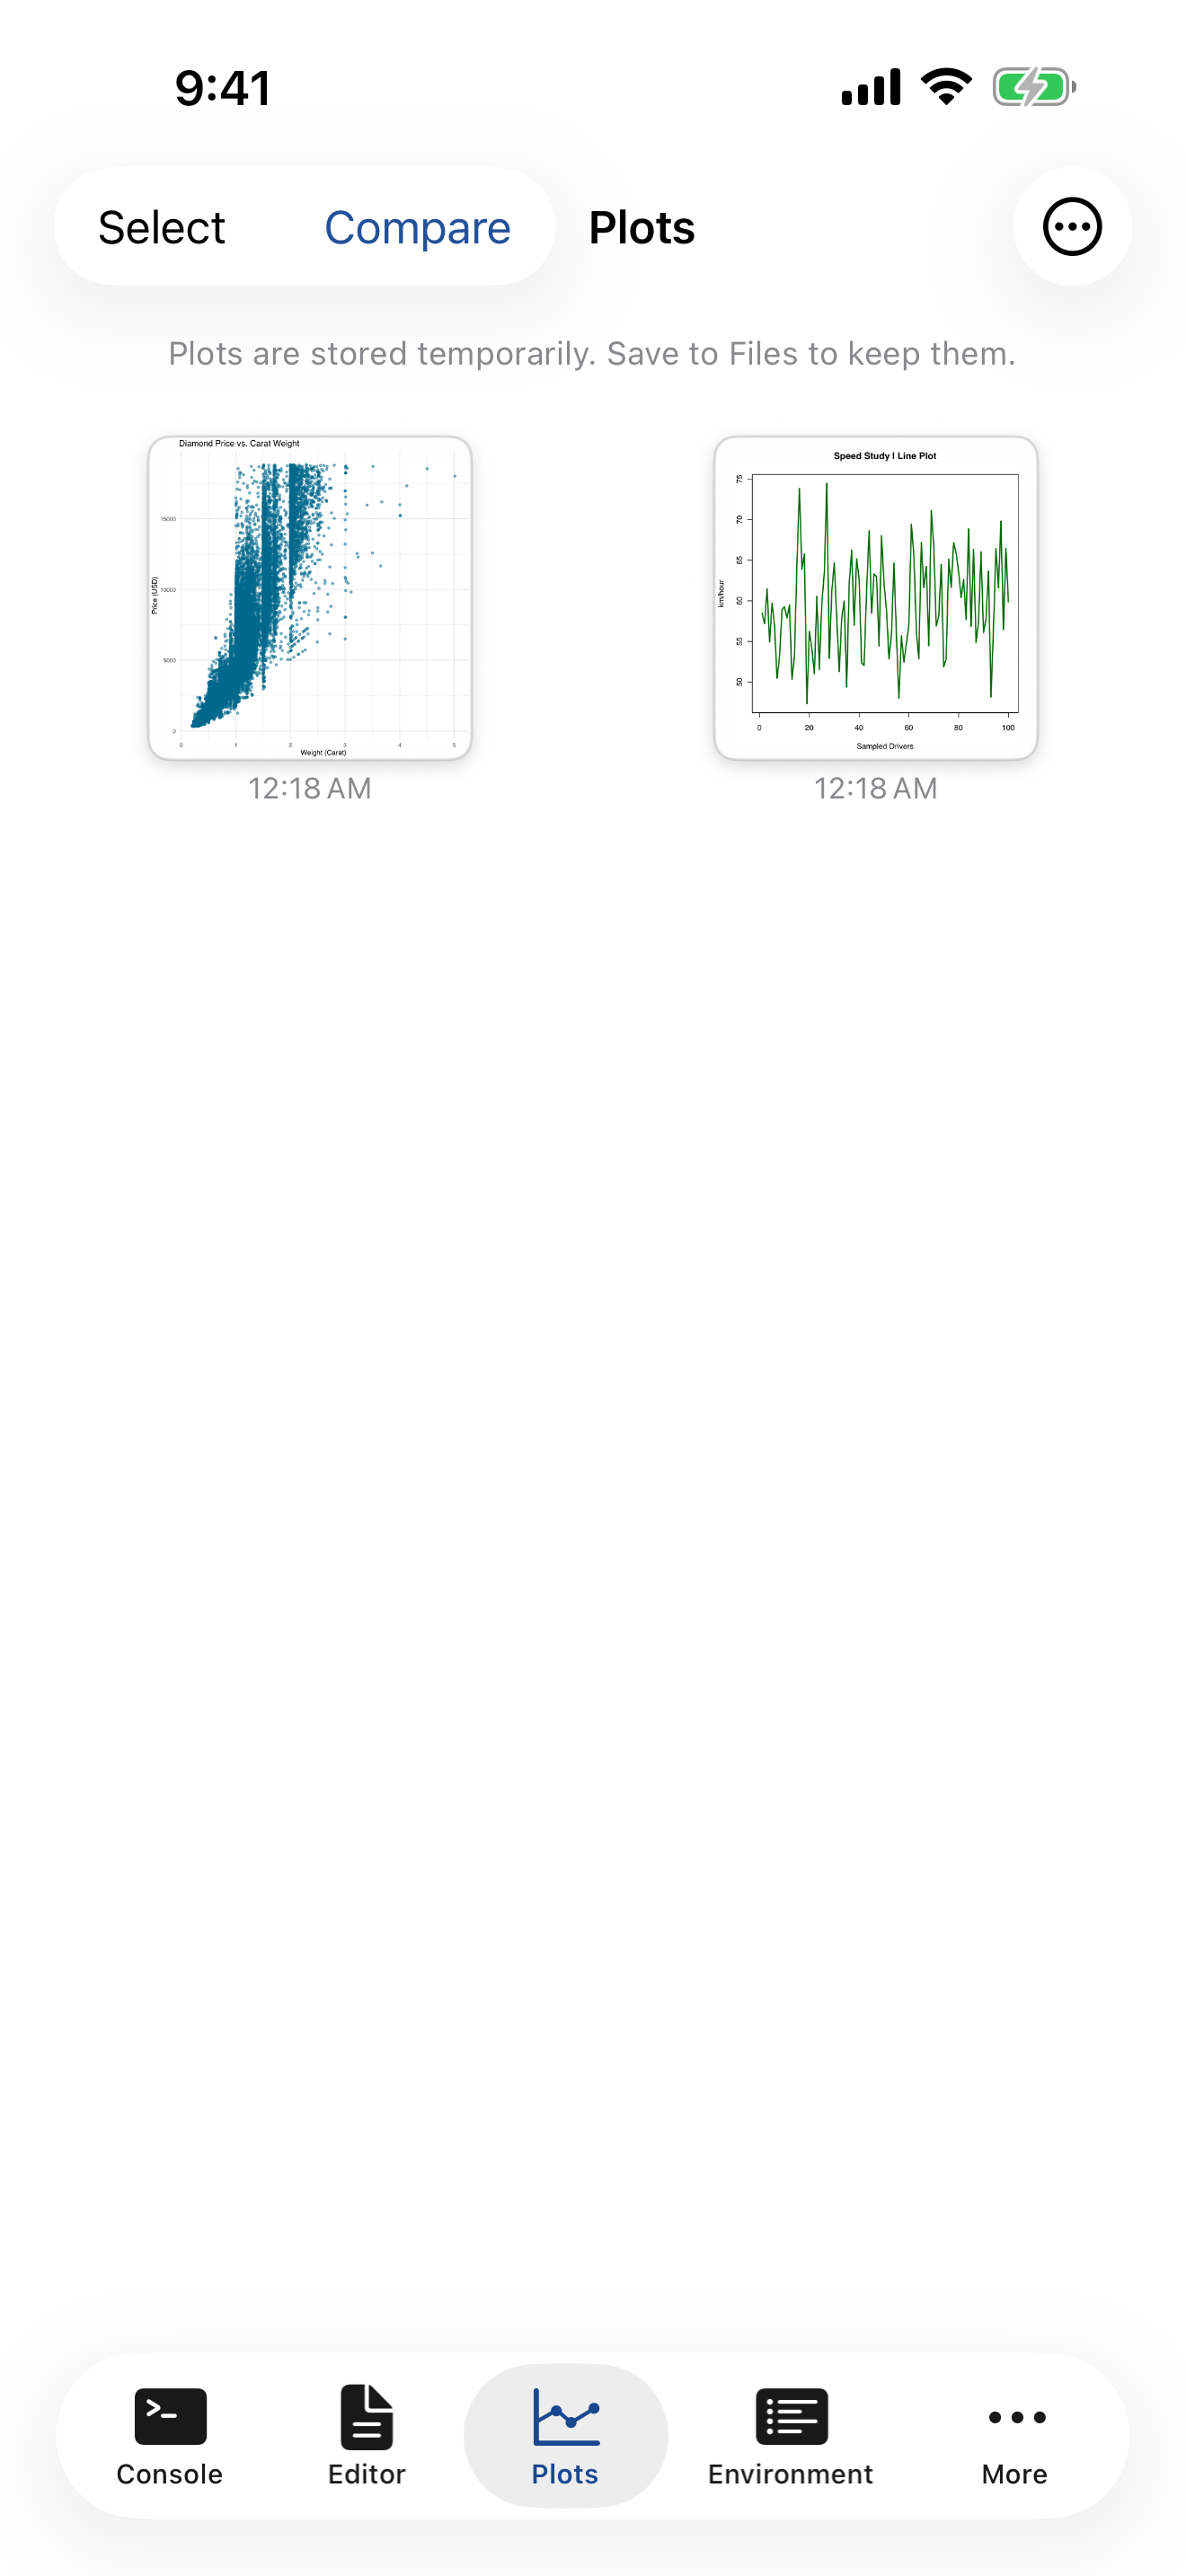
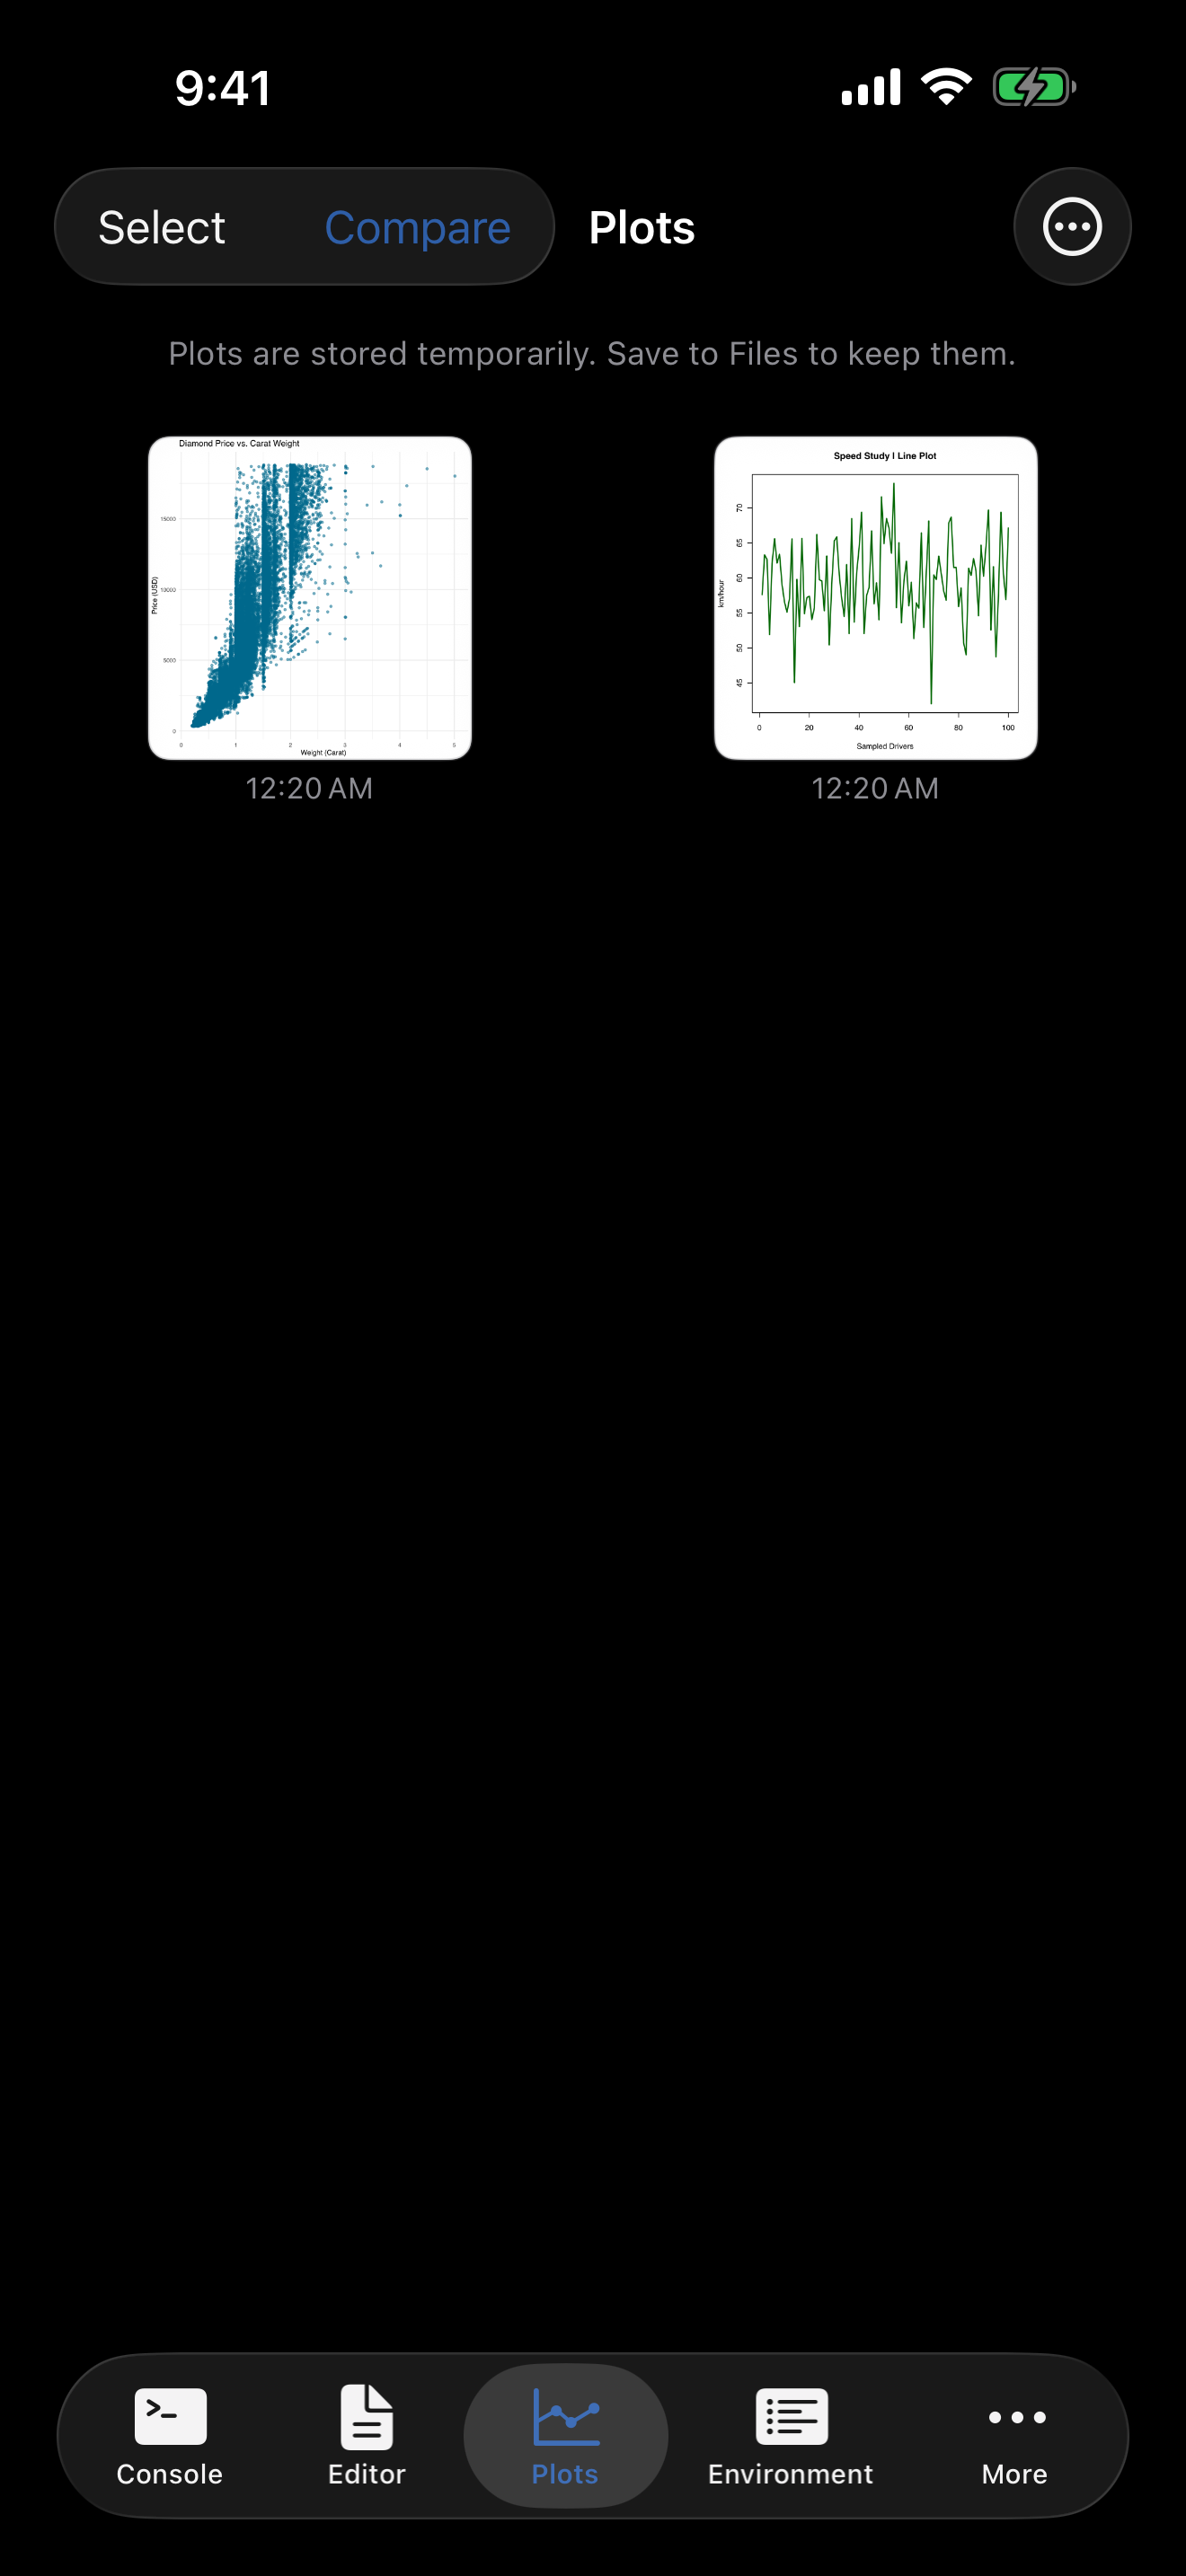
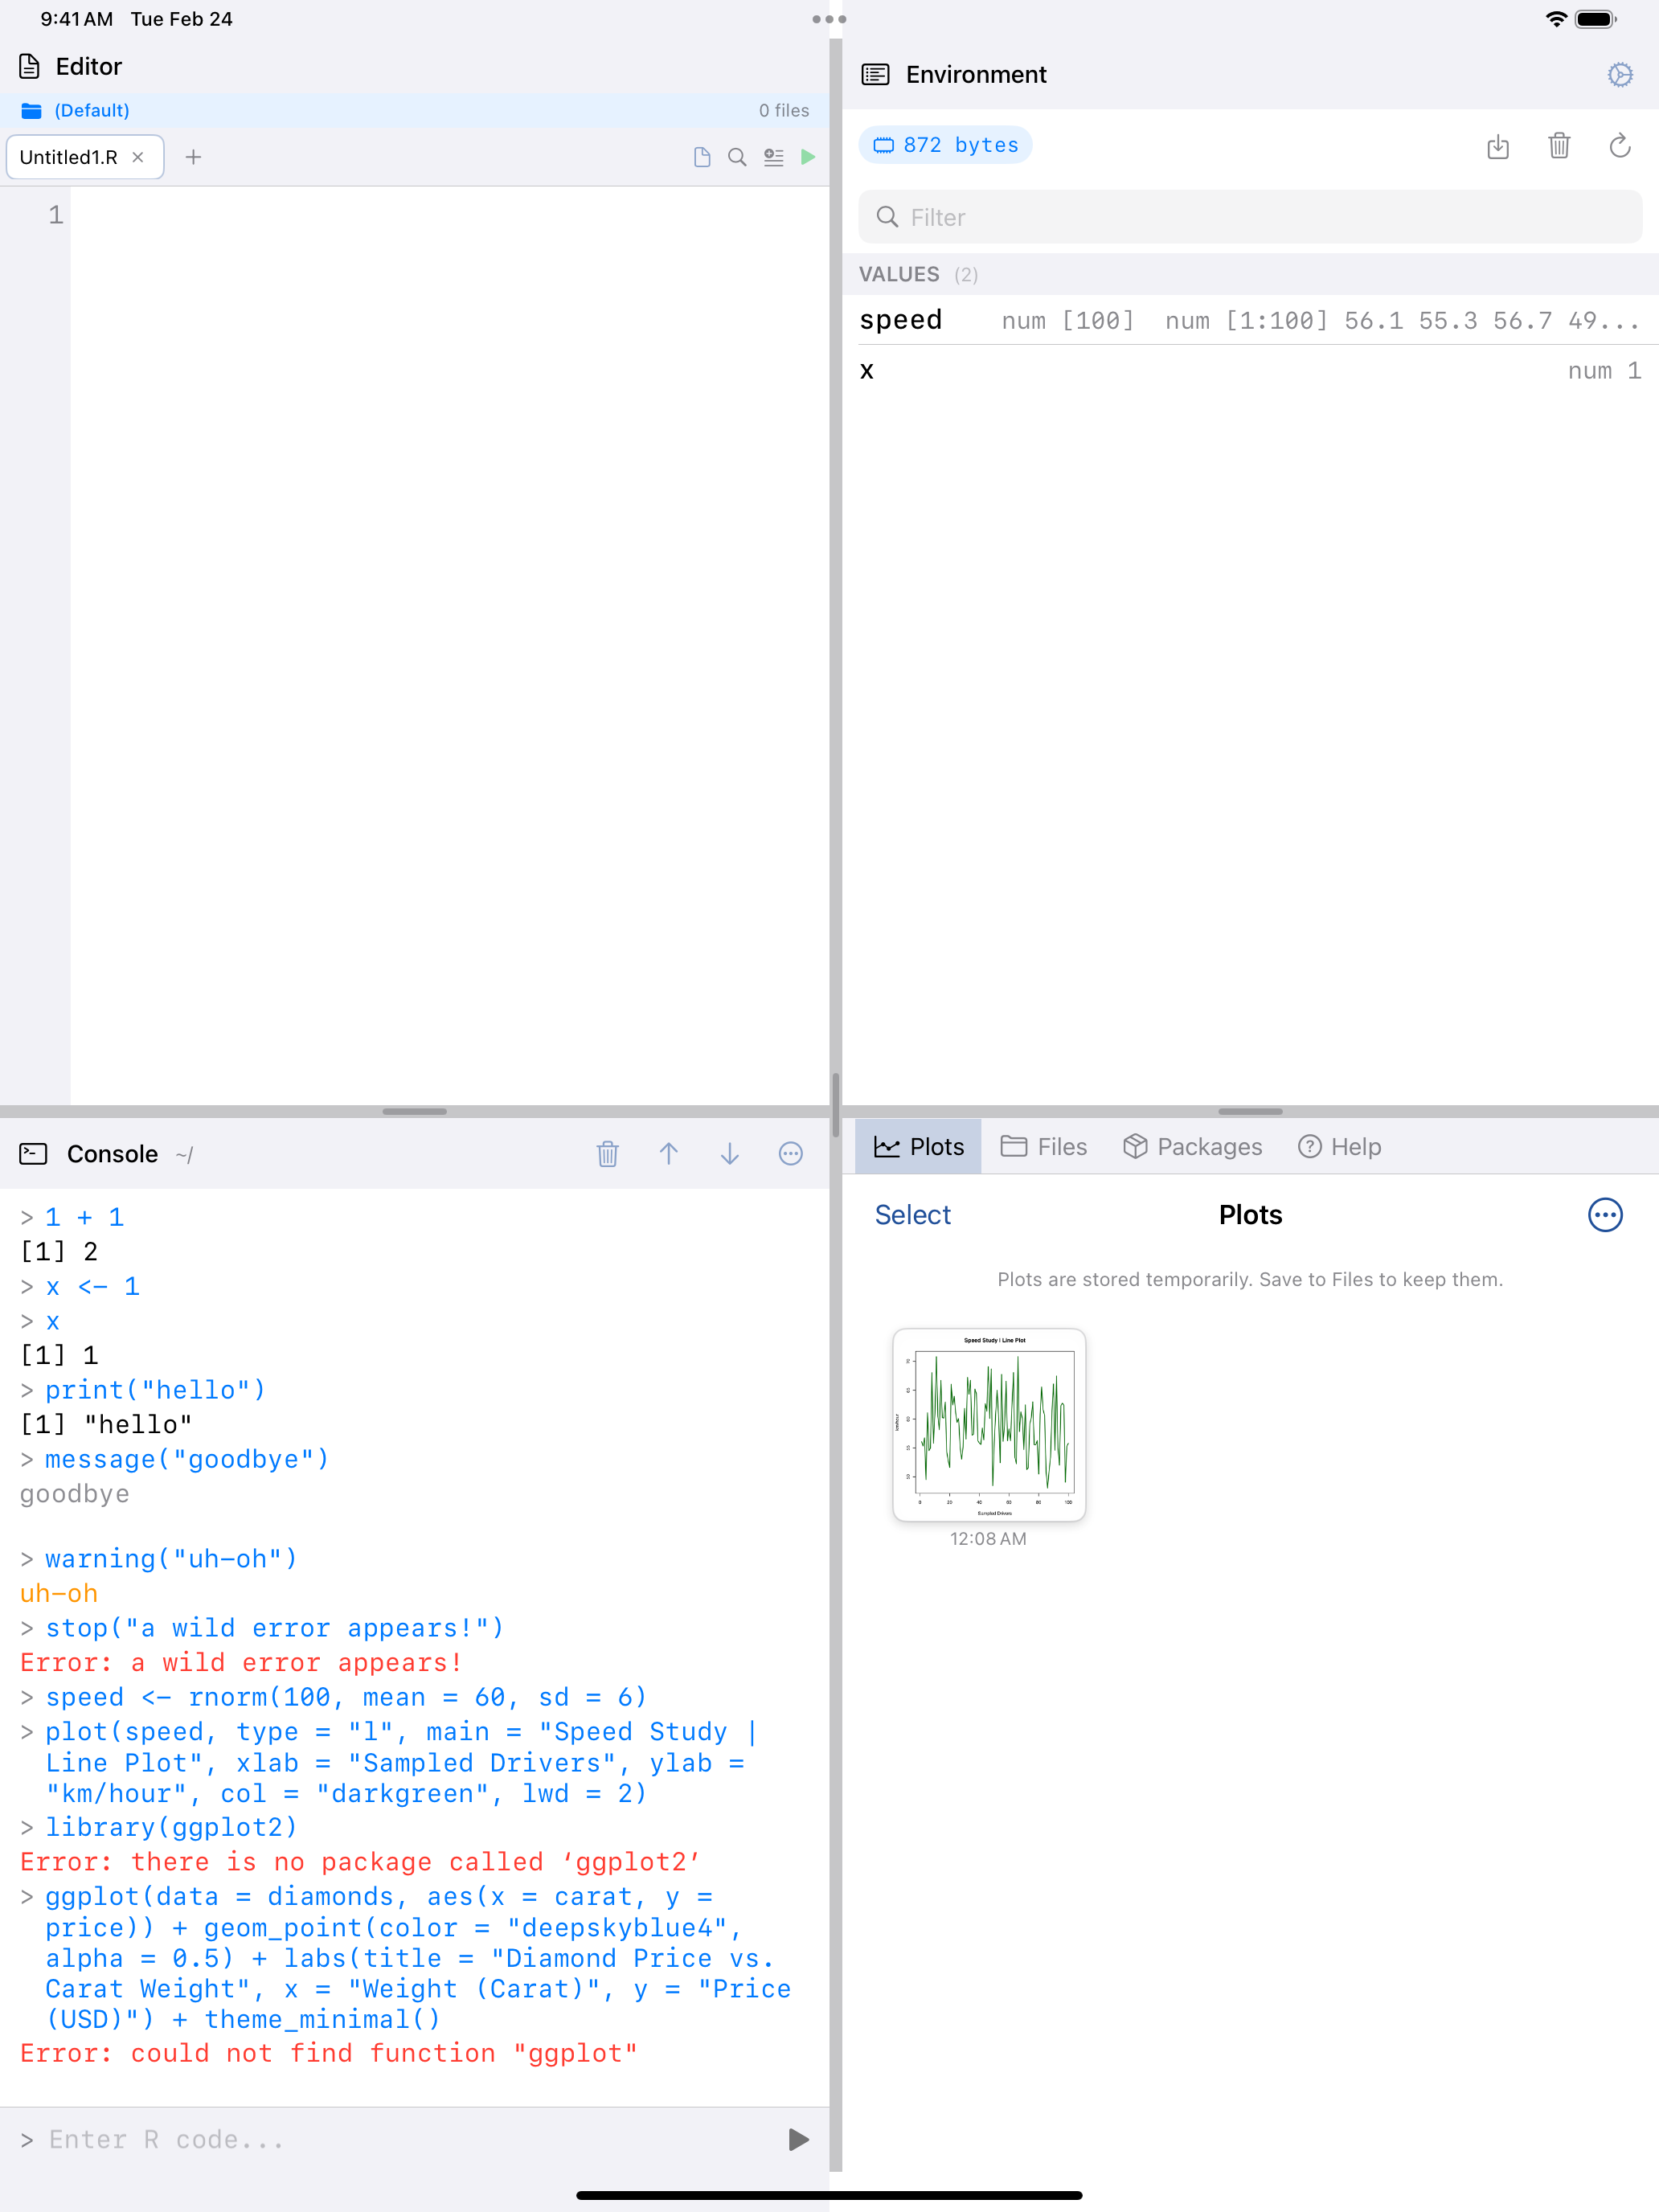
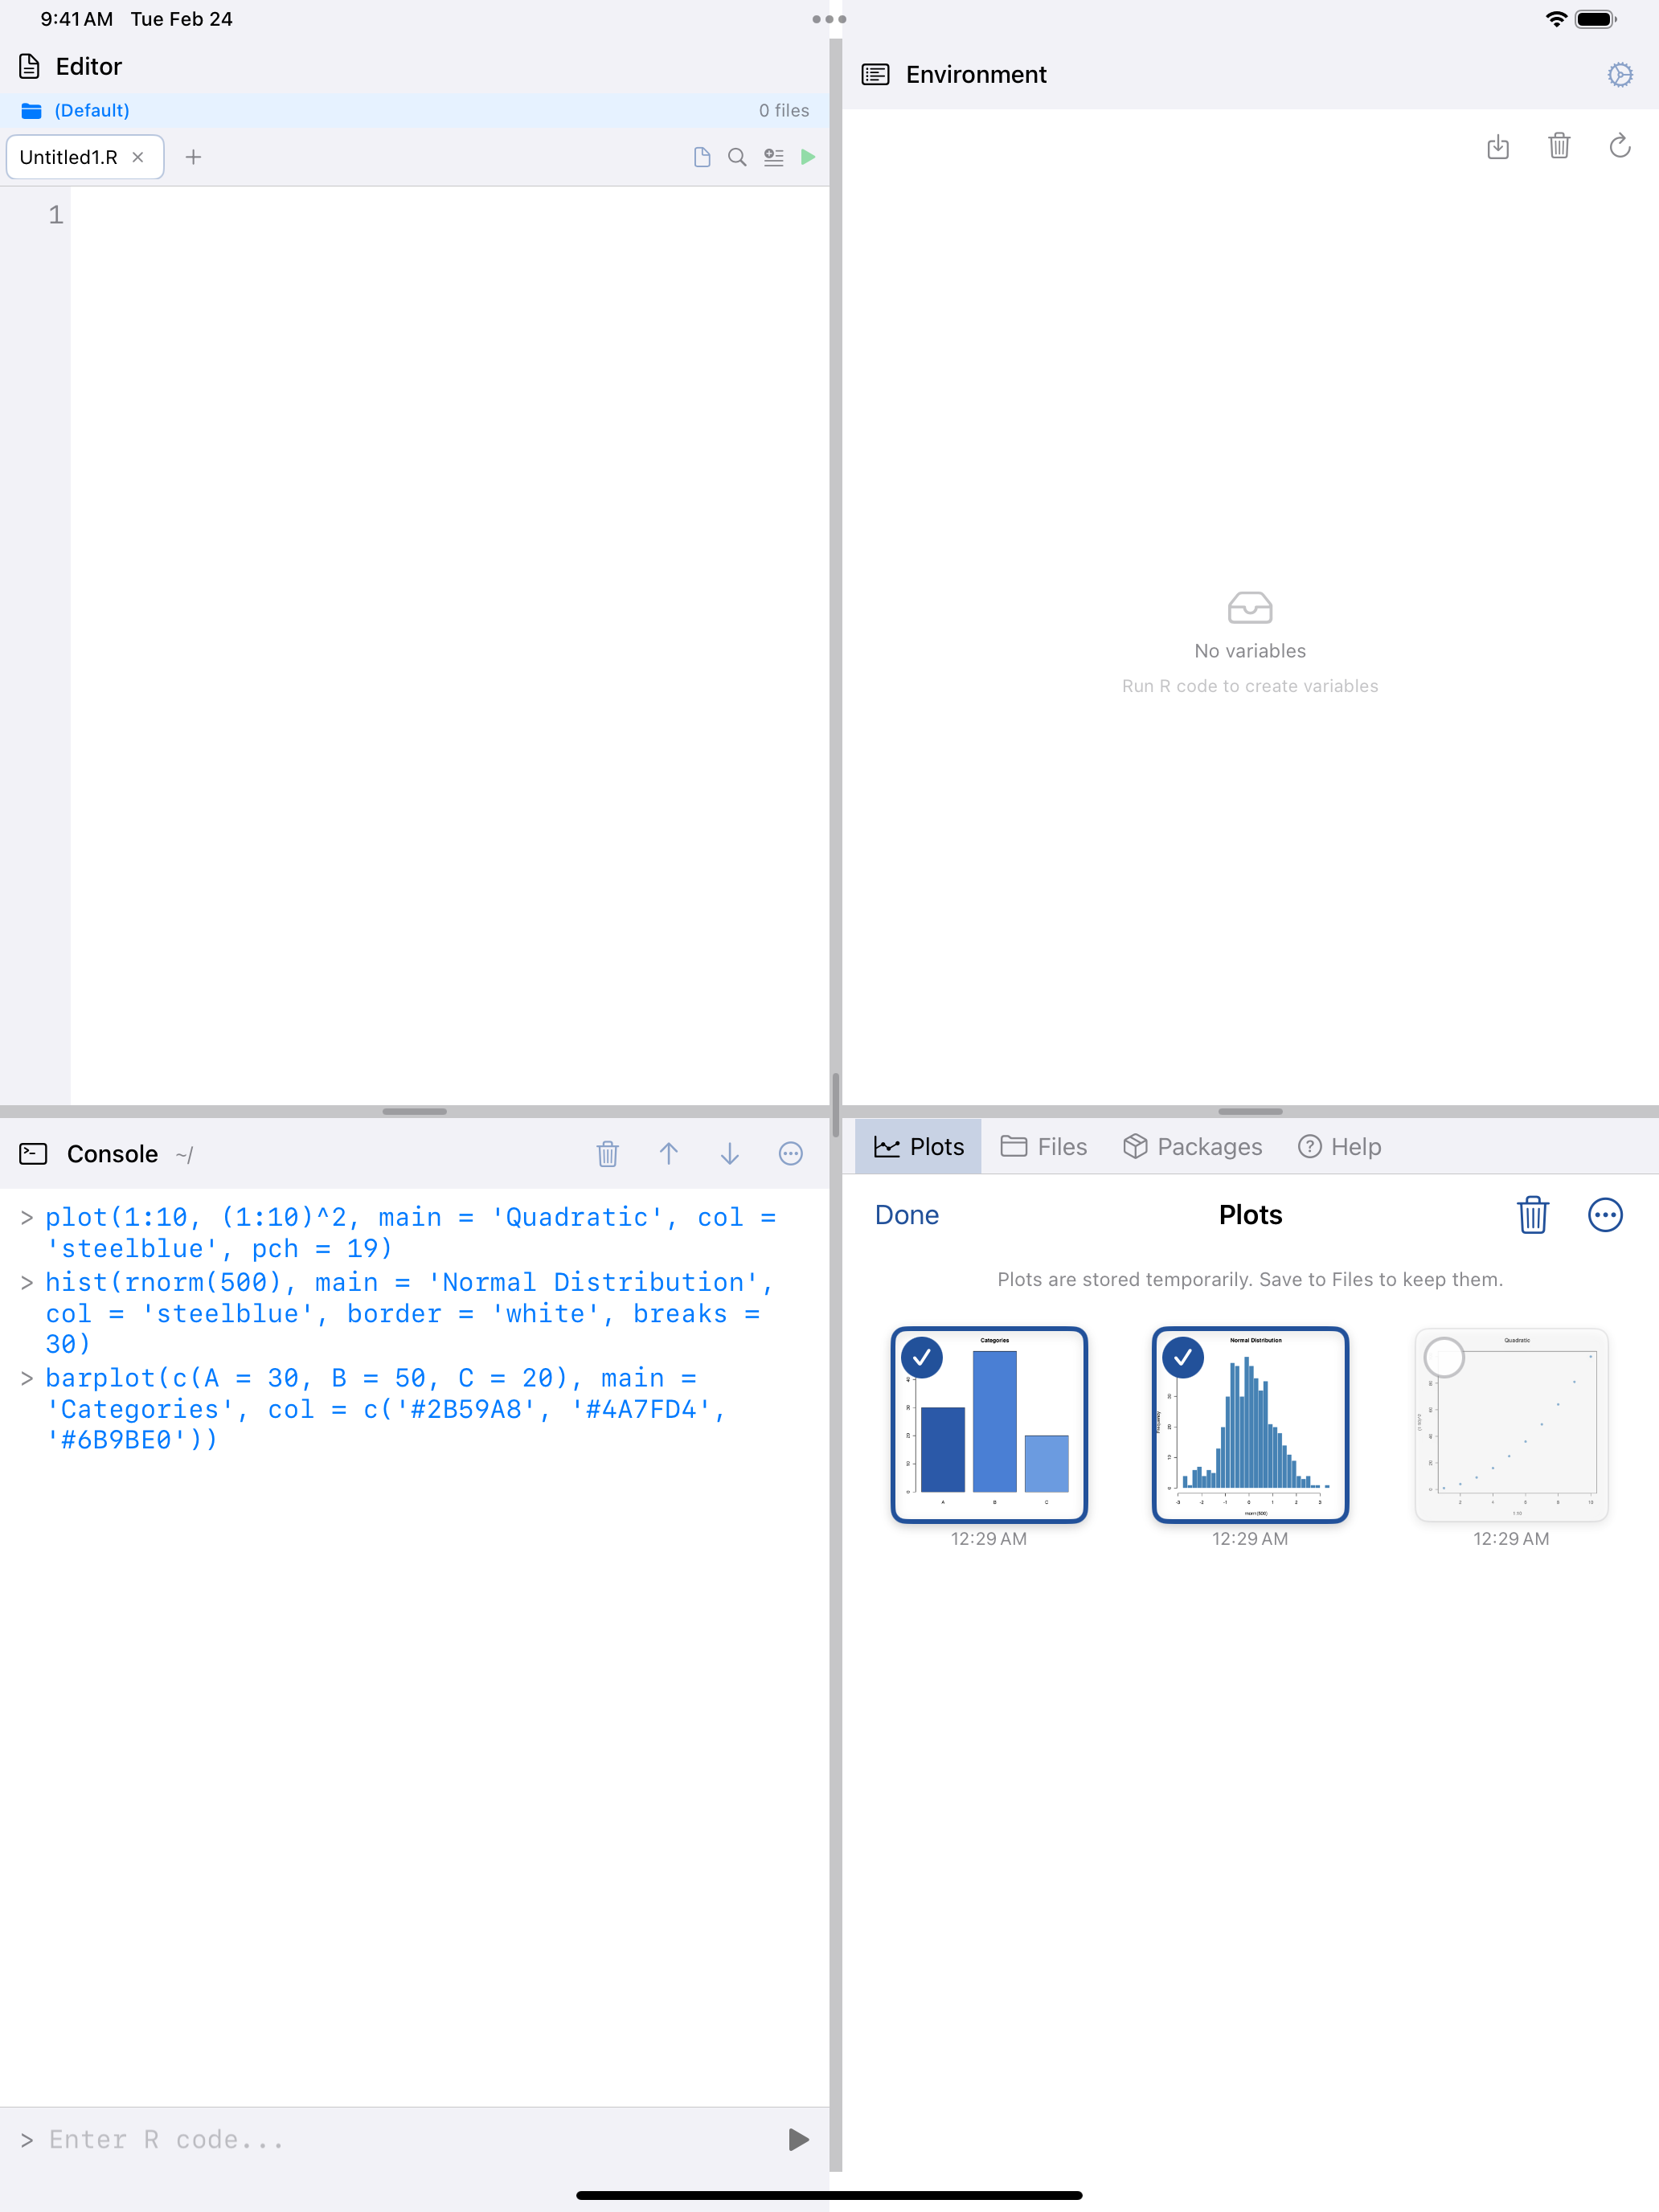
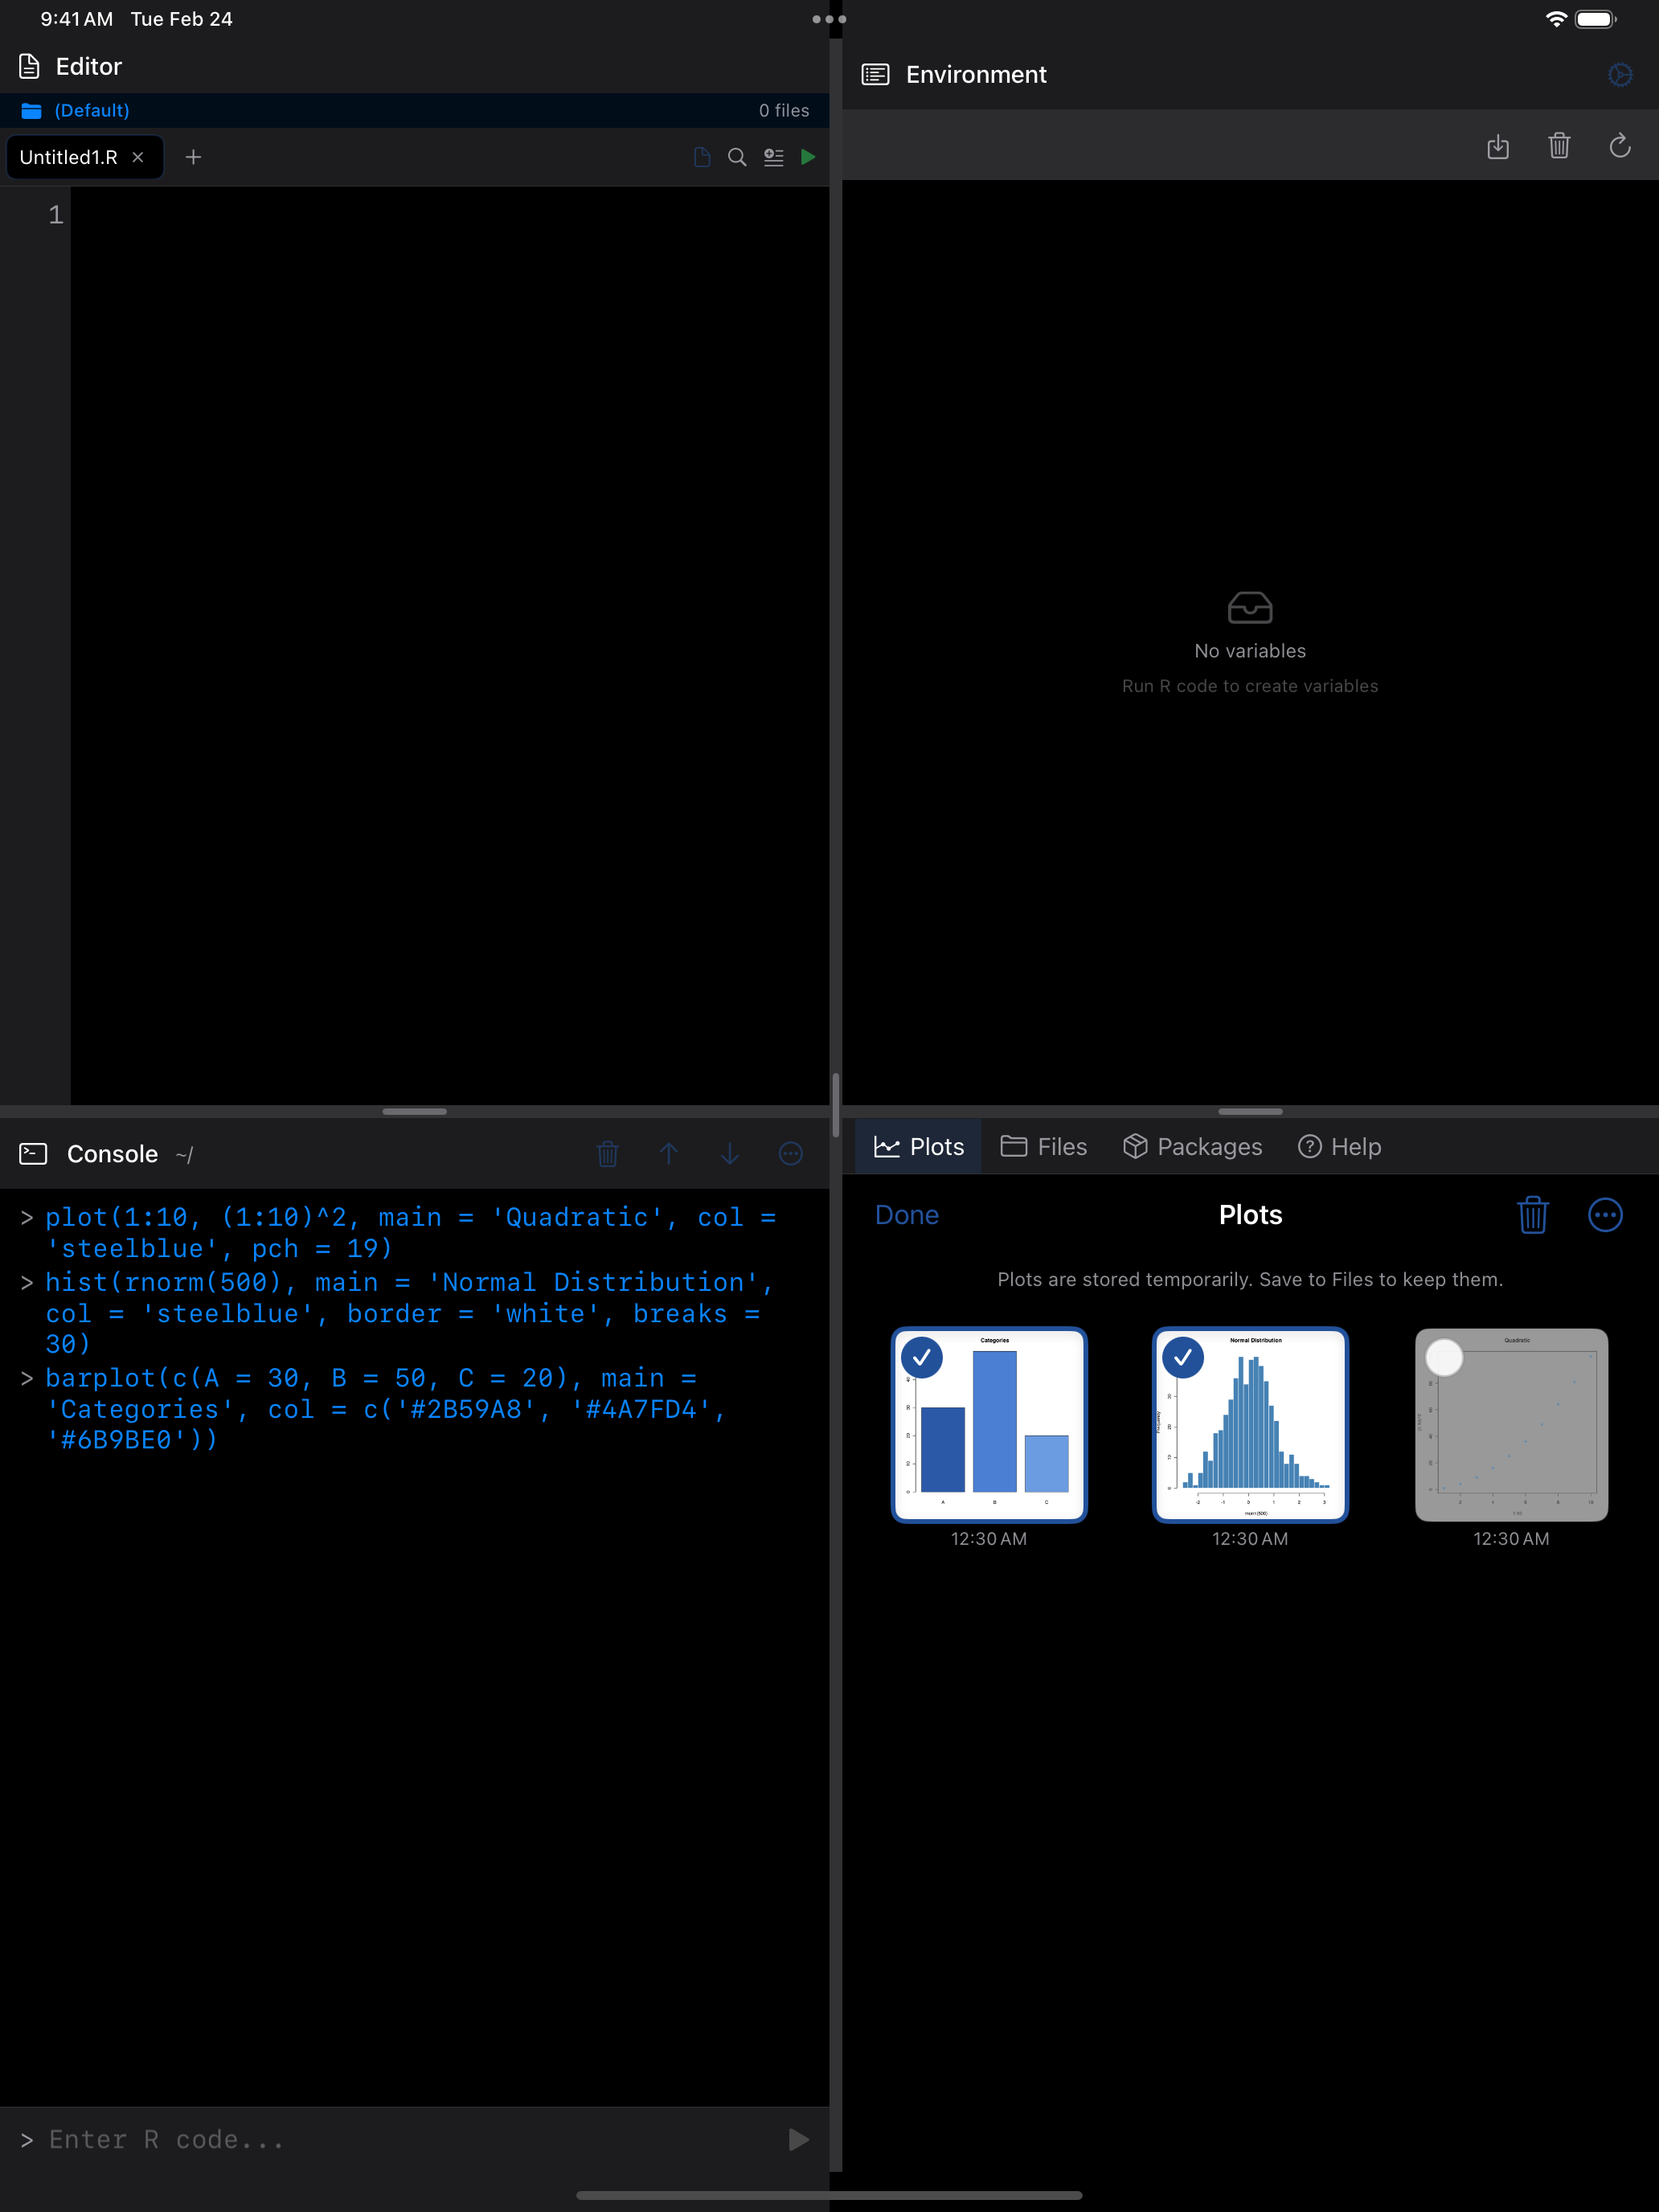
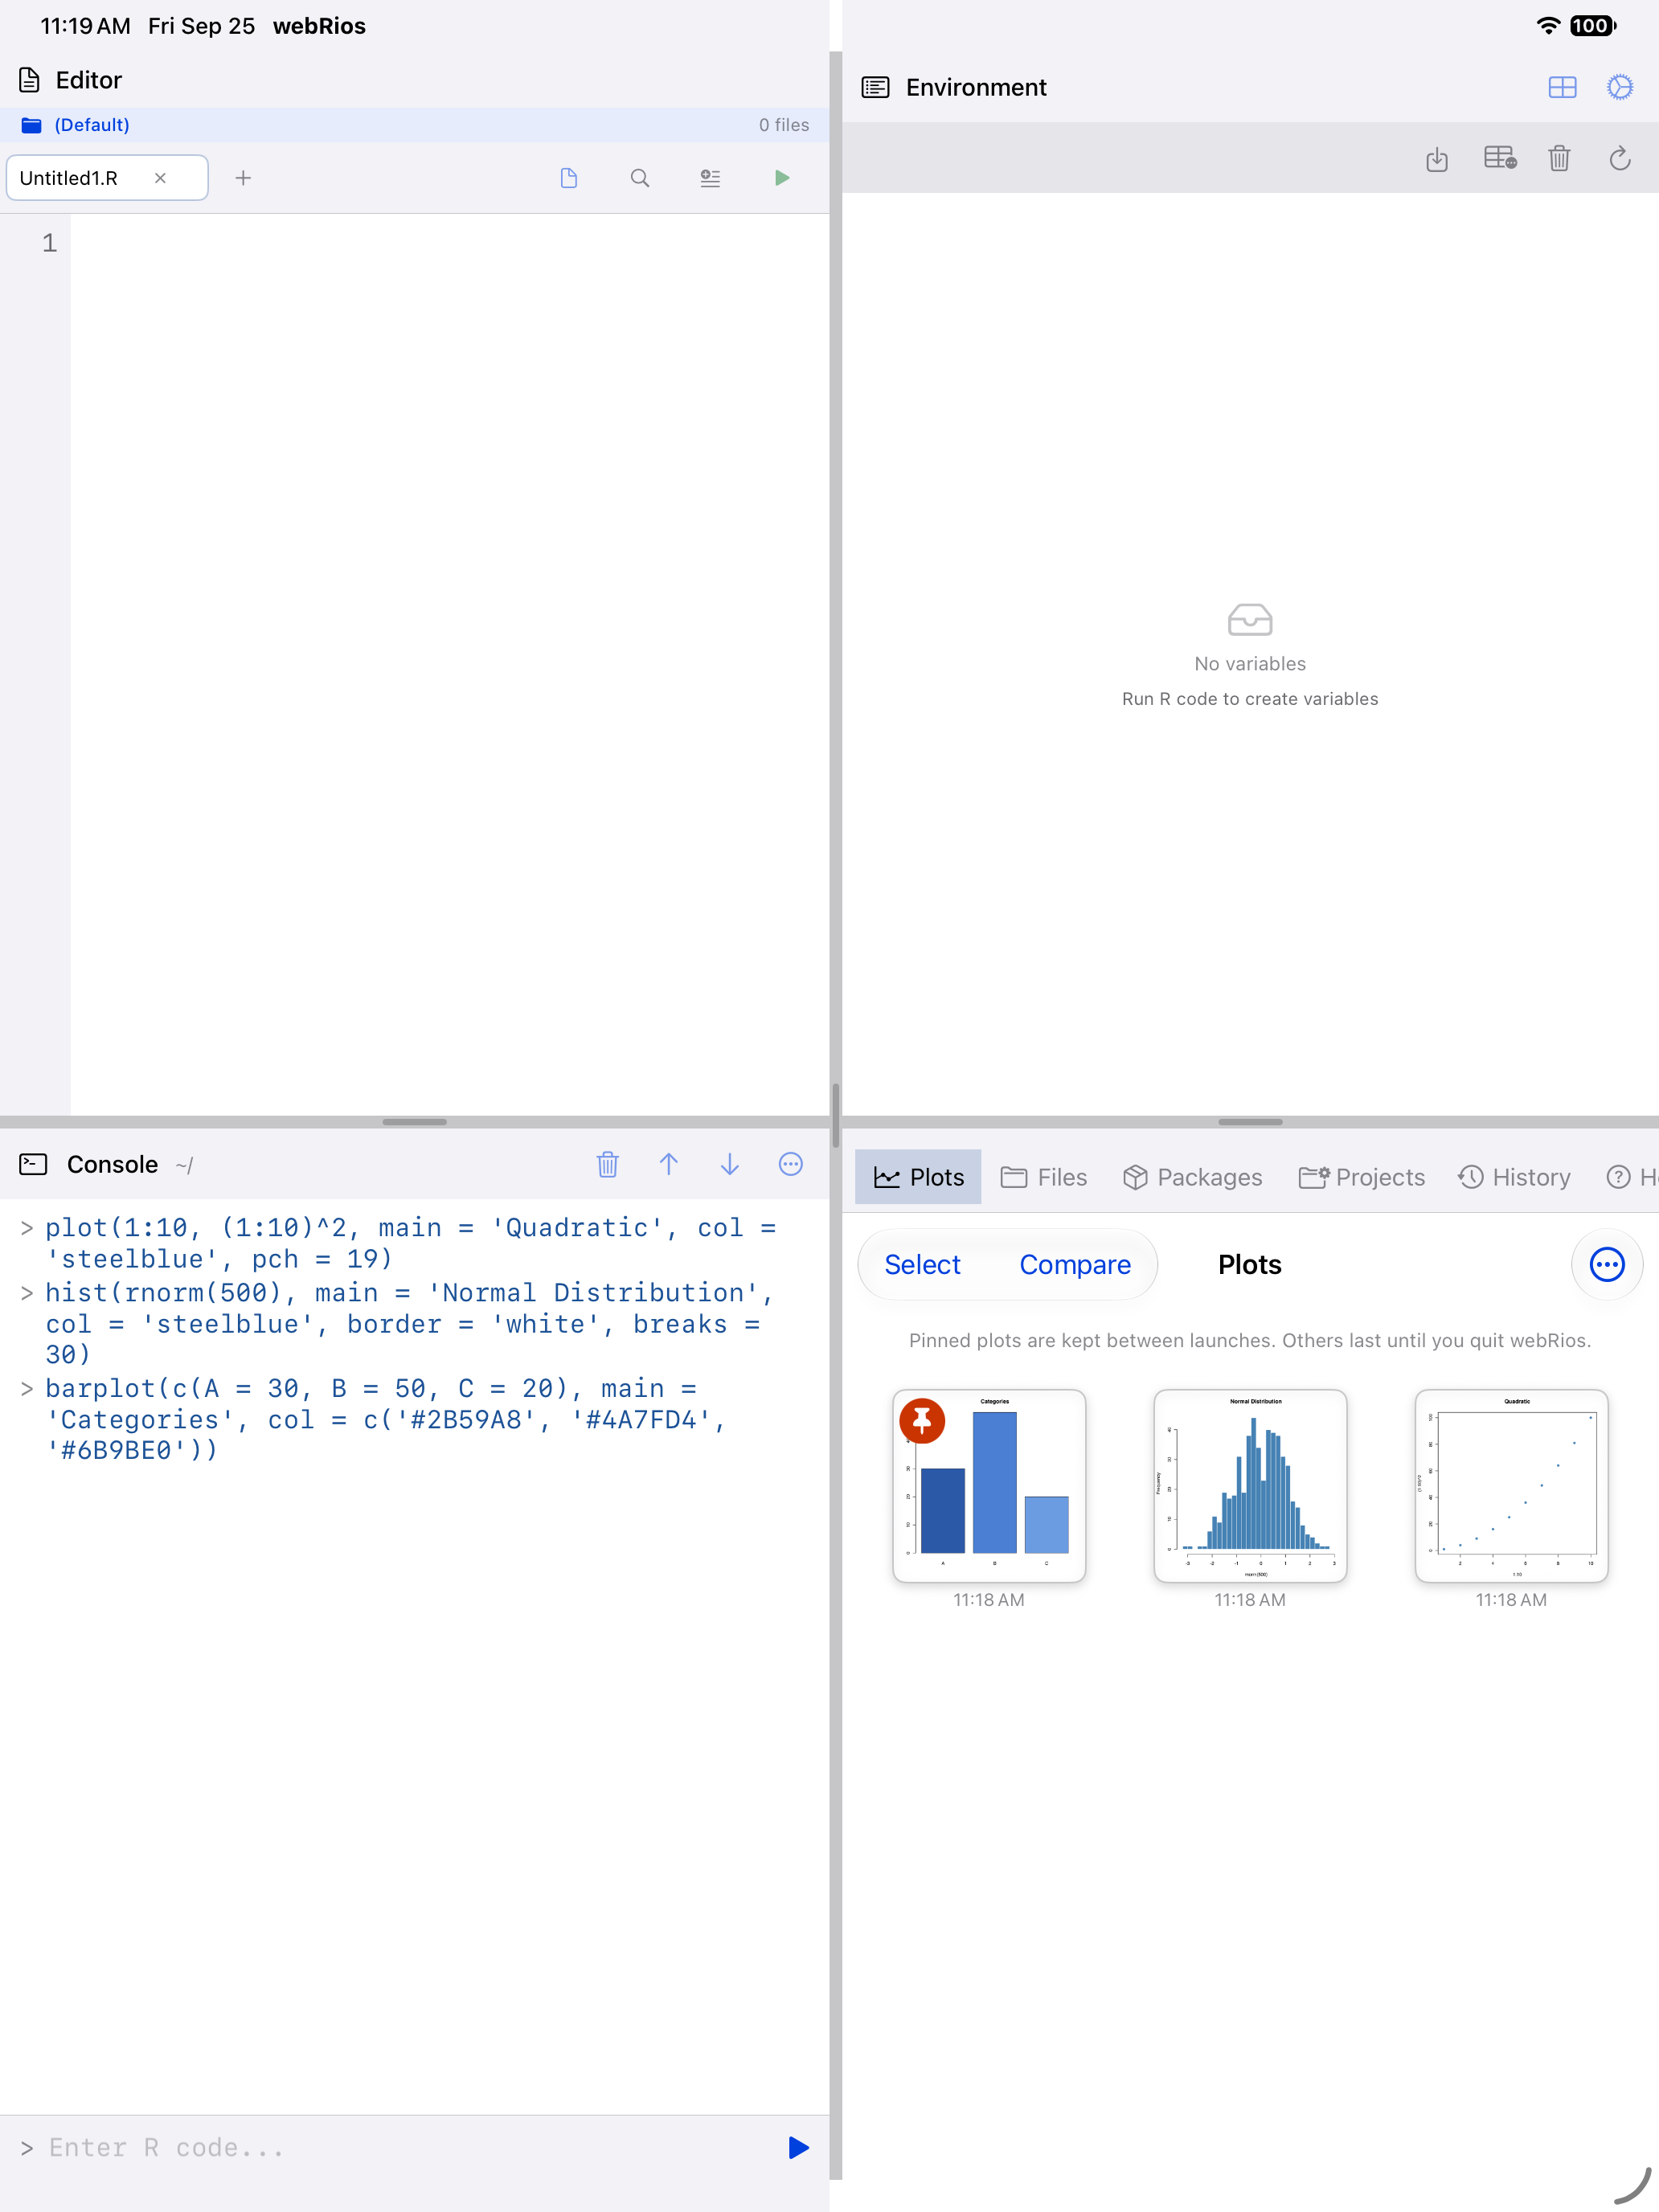
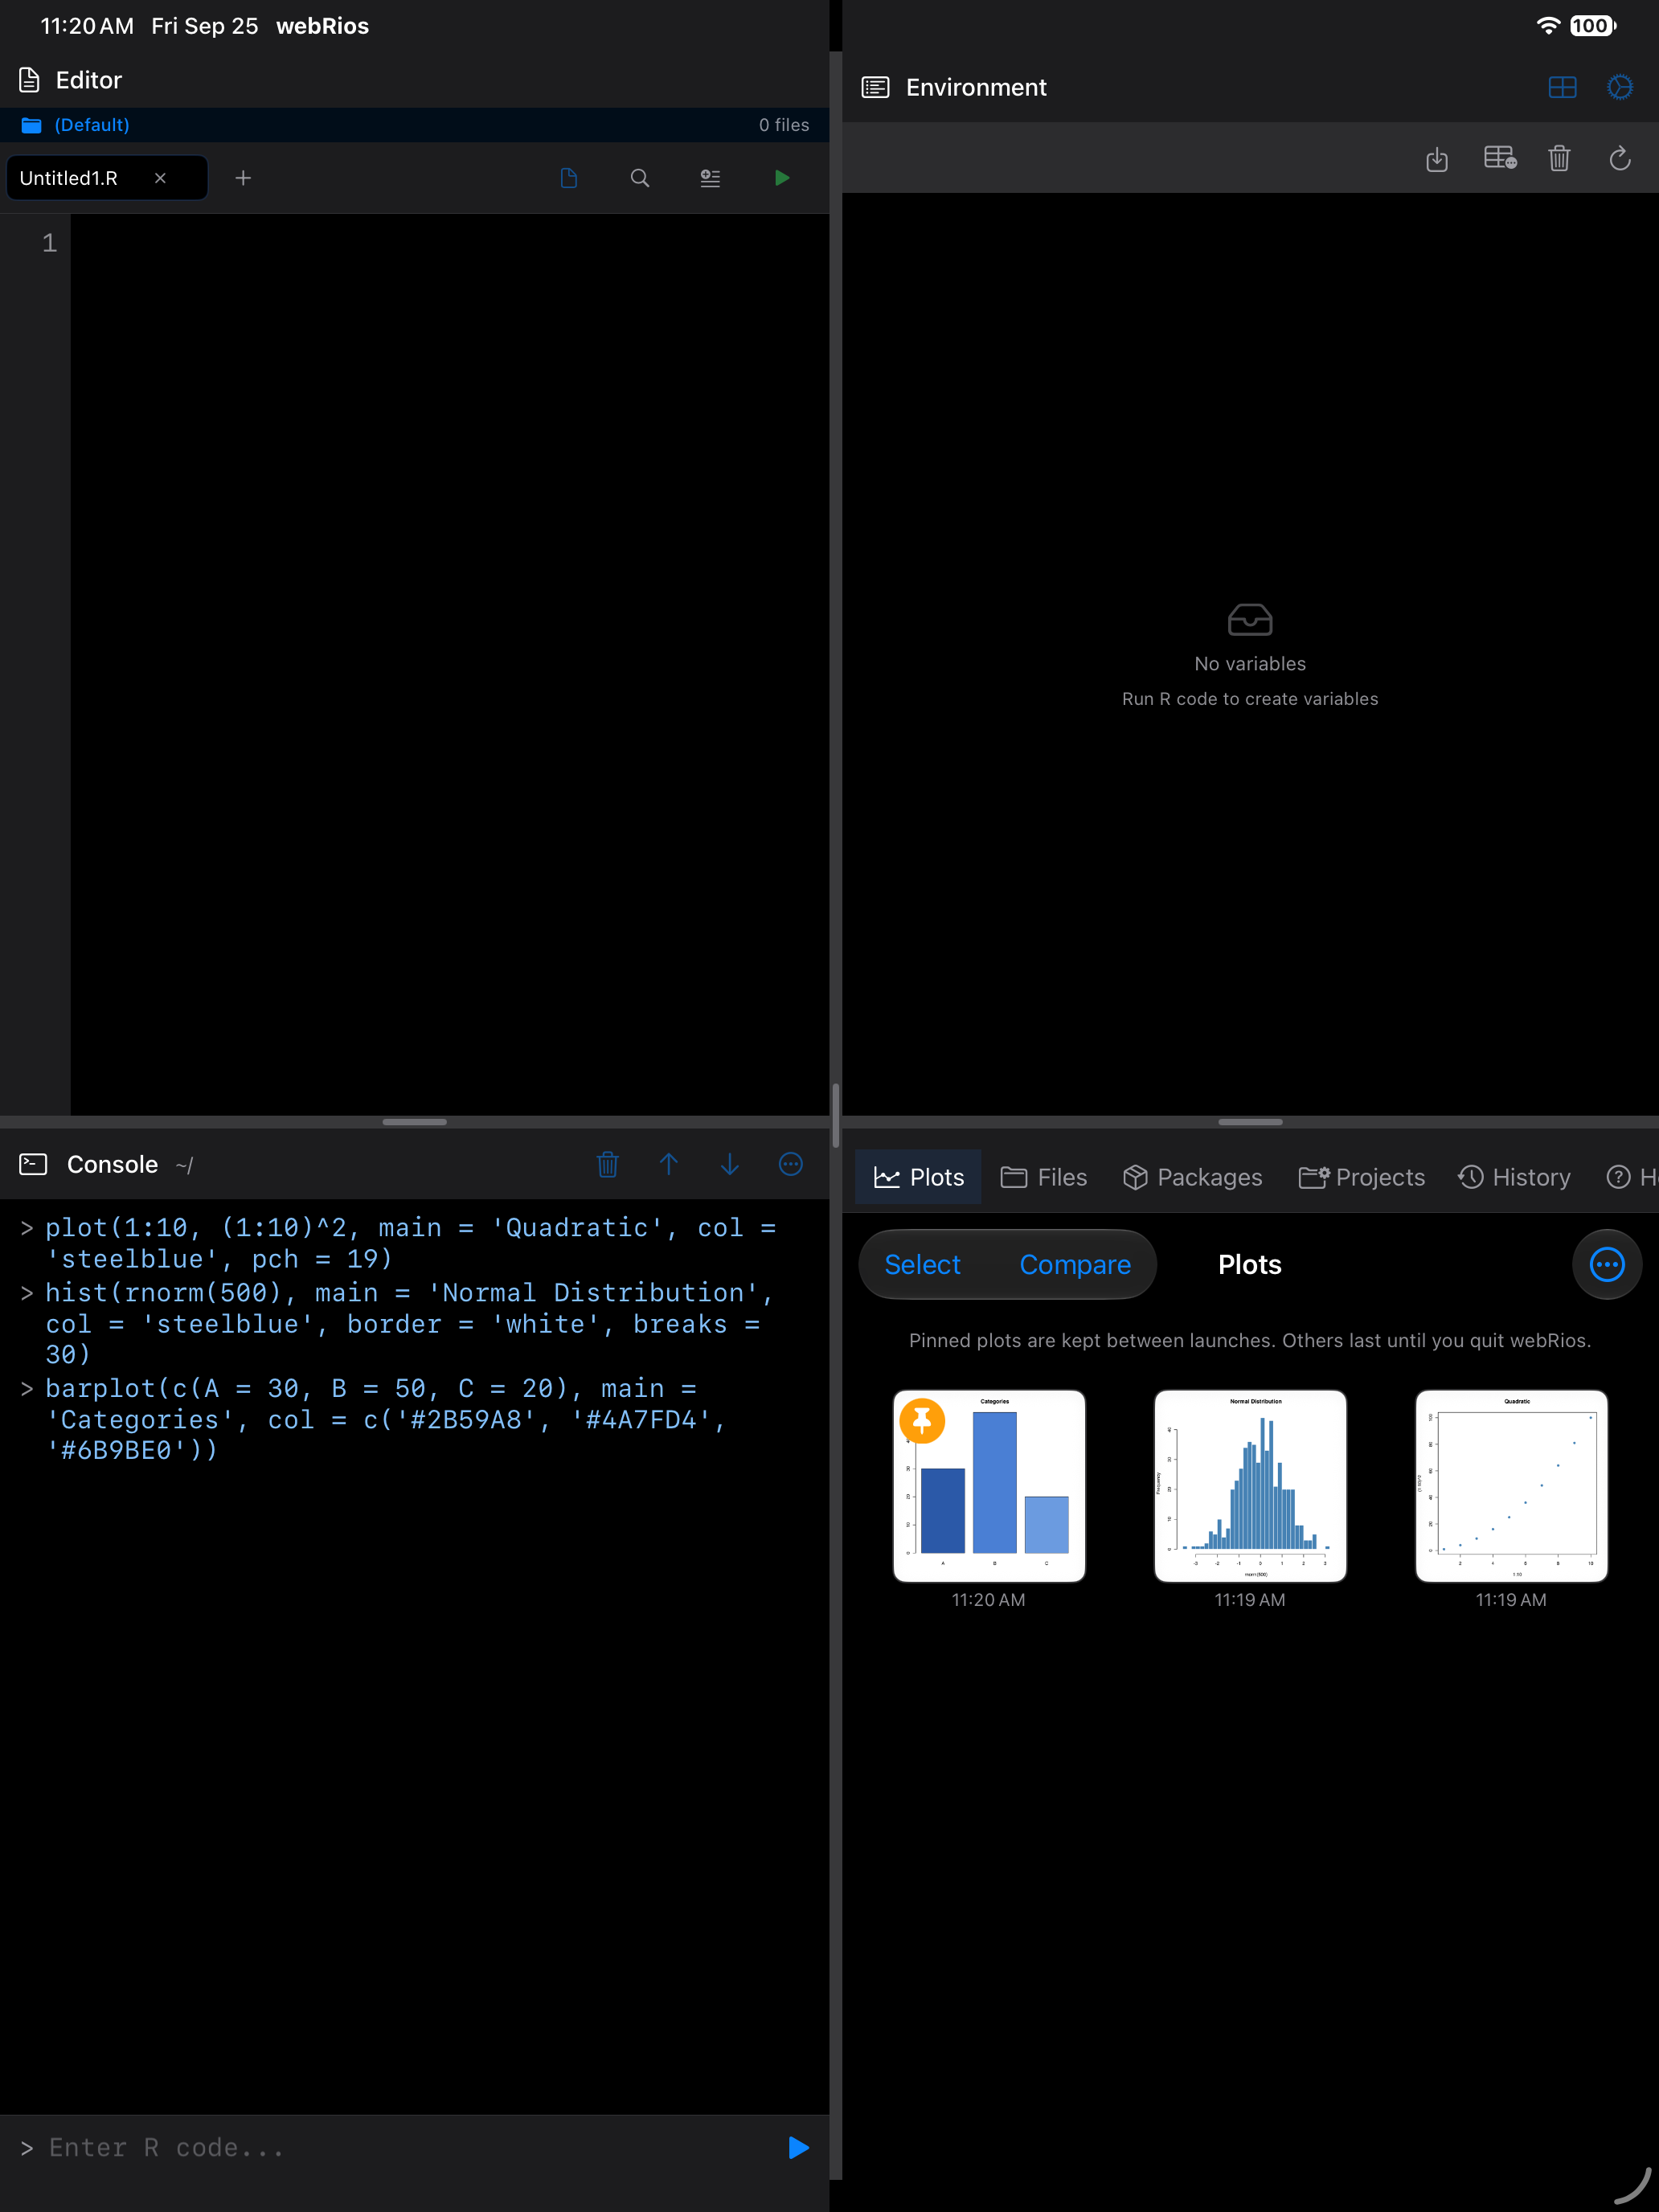
The Plots tab shows all your captured plots as a grid of thumbnails, with the most recent plots at the end. Each thumbnail includes a timestamp so you can tell when it was created.
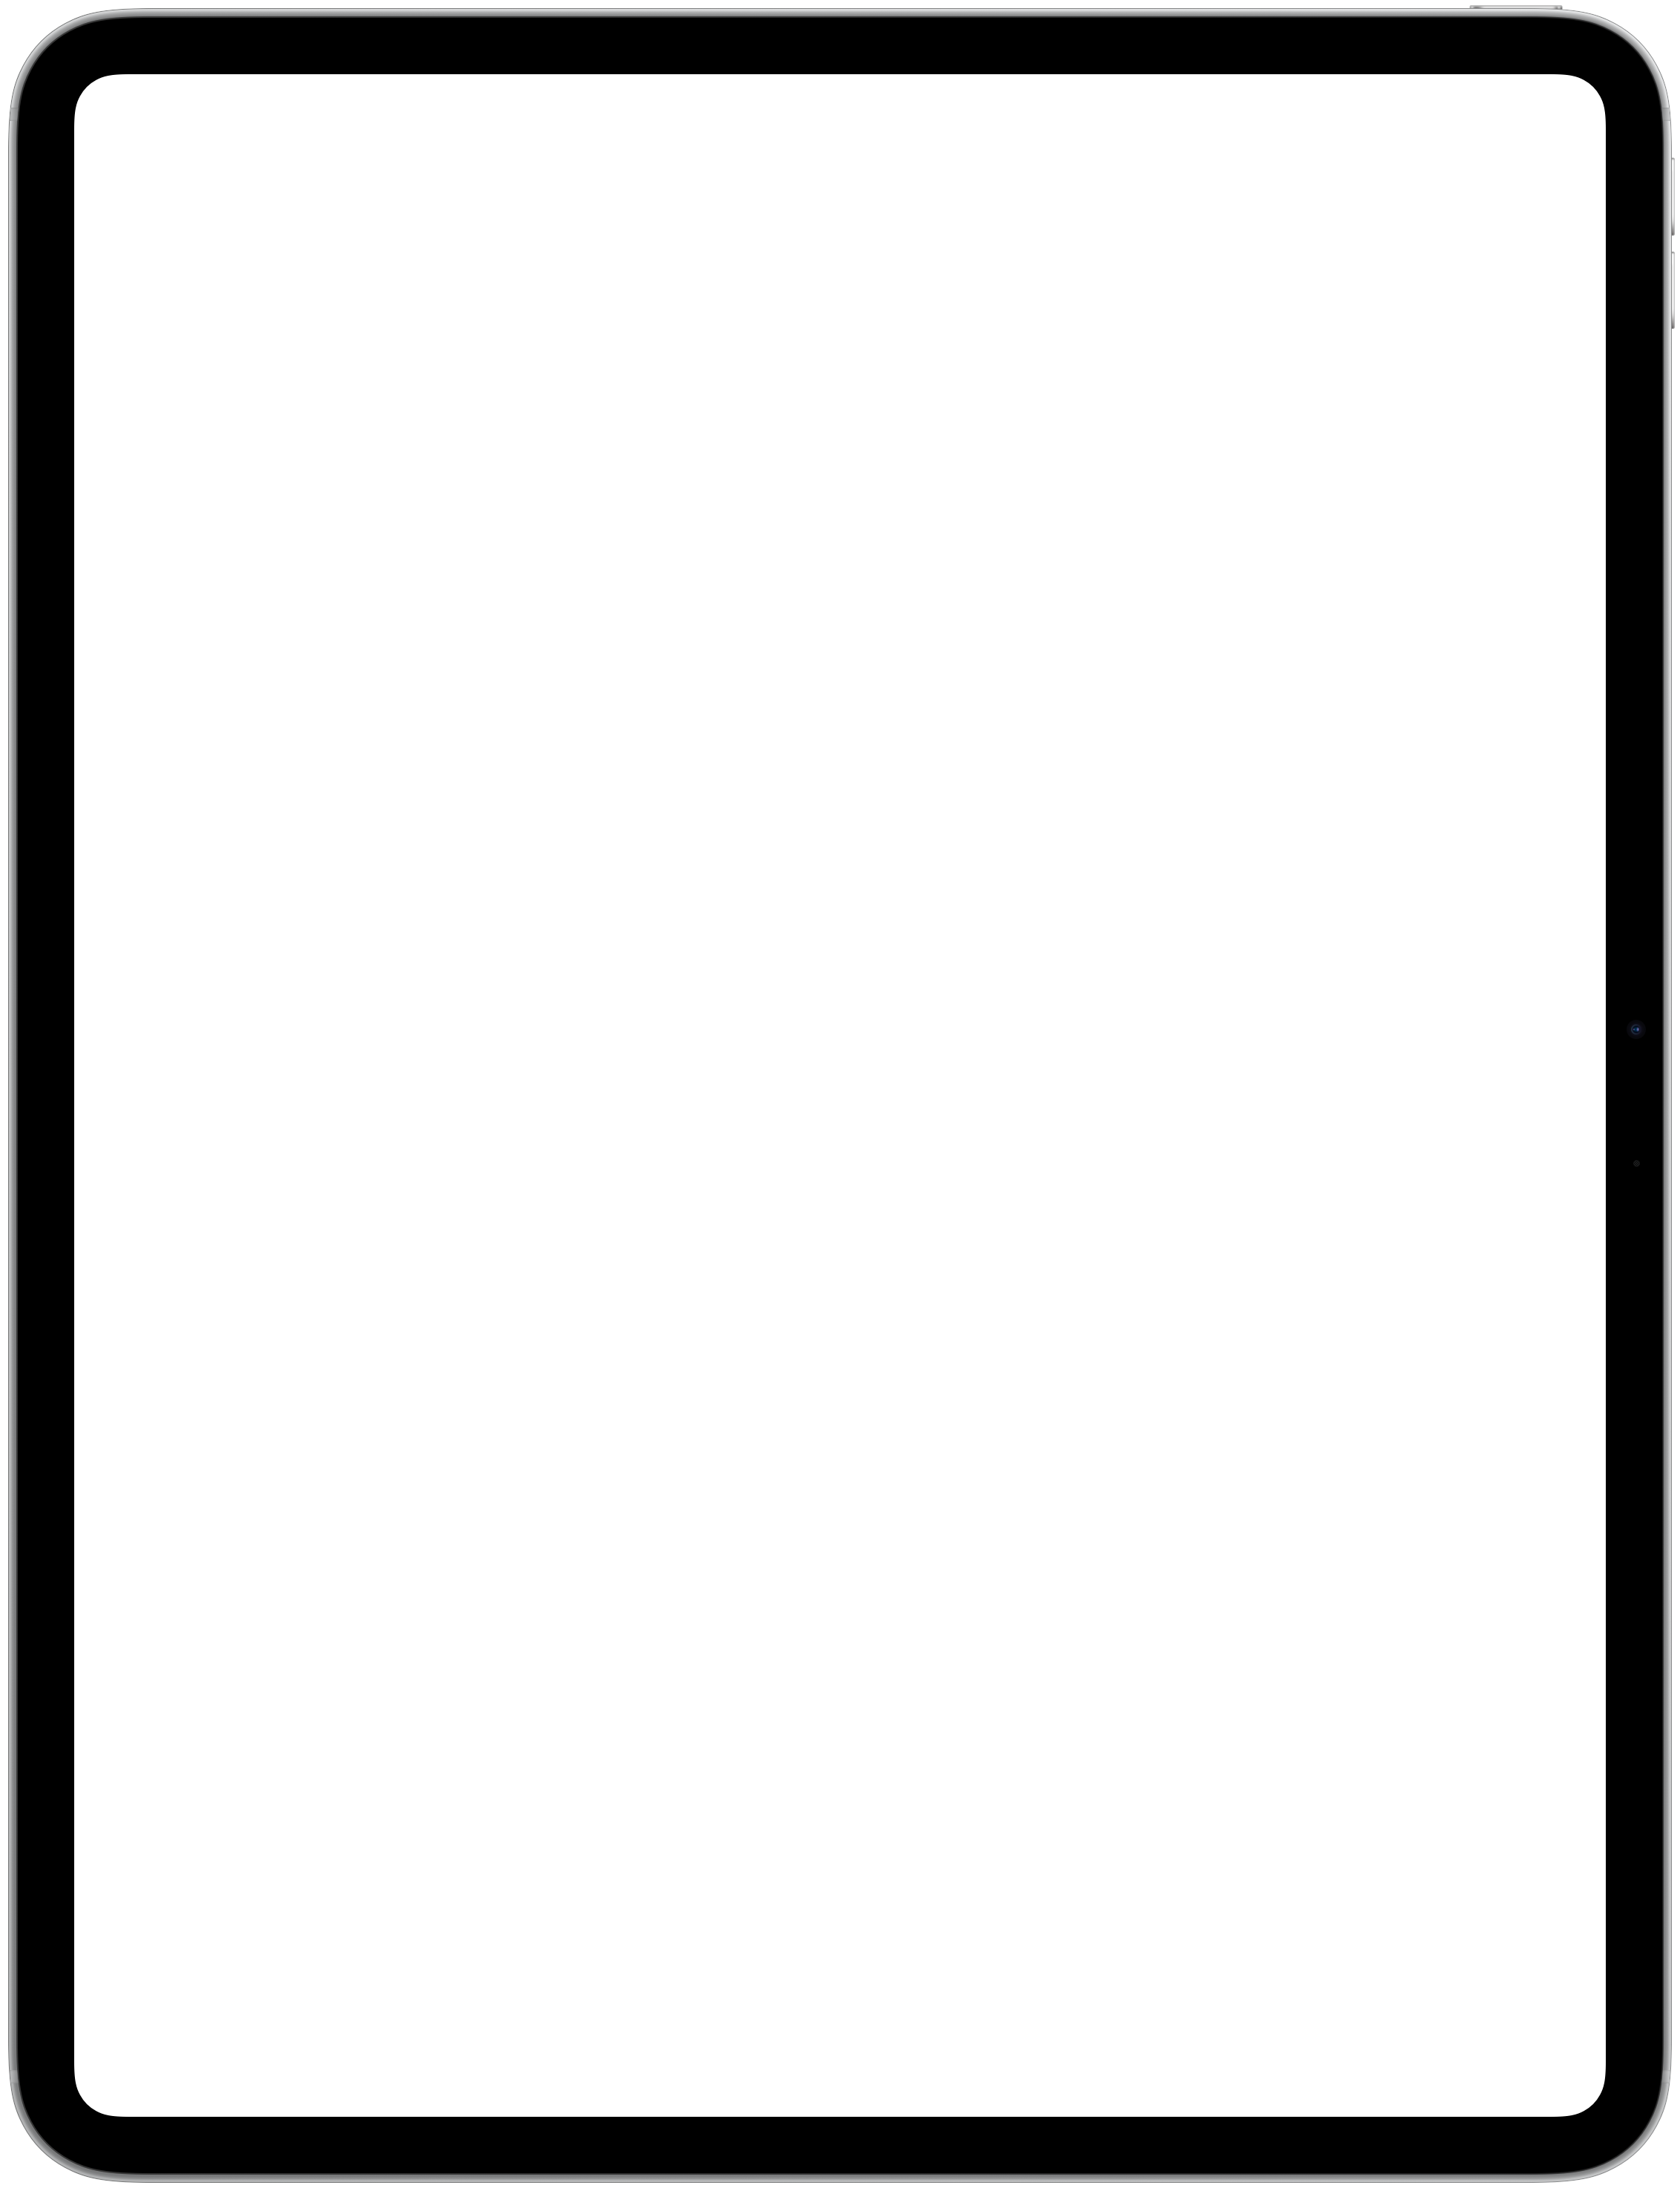
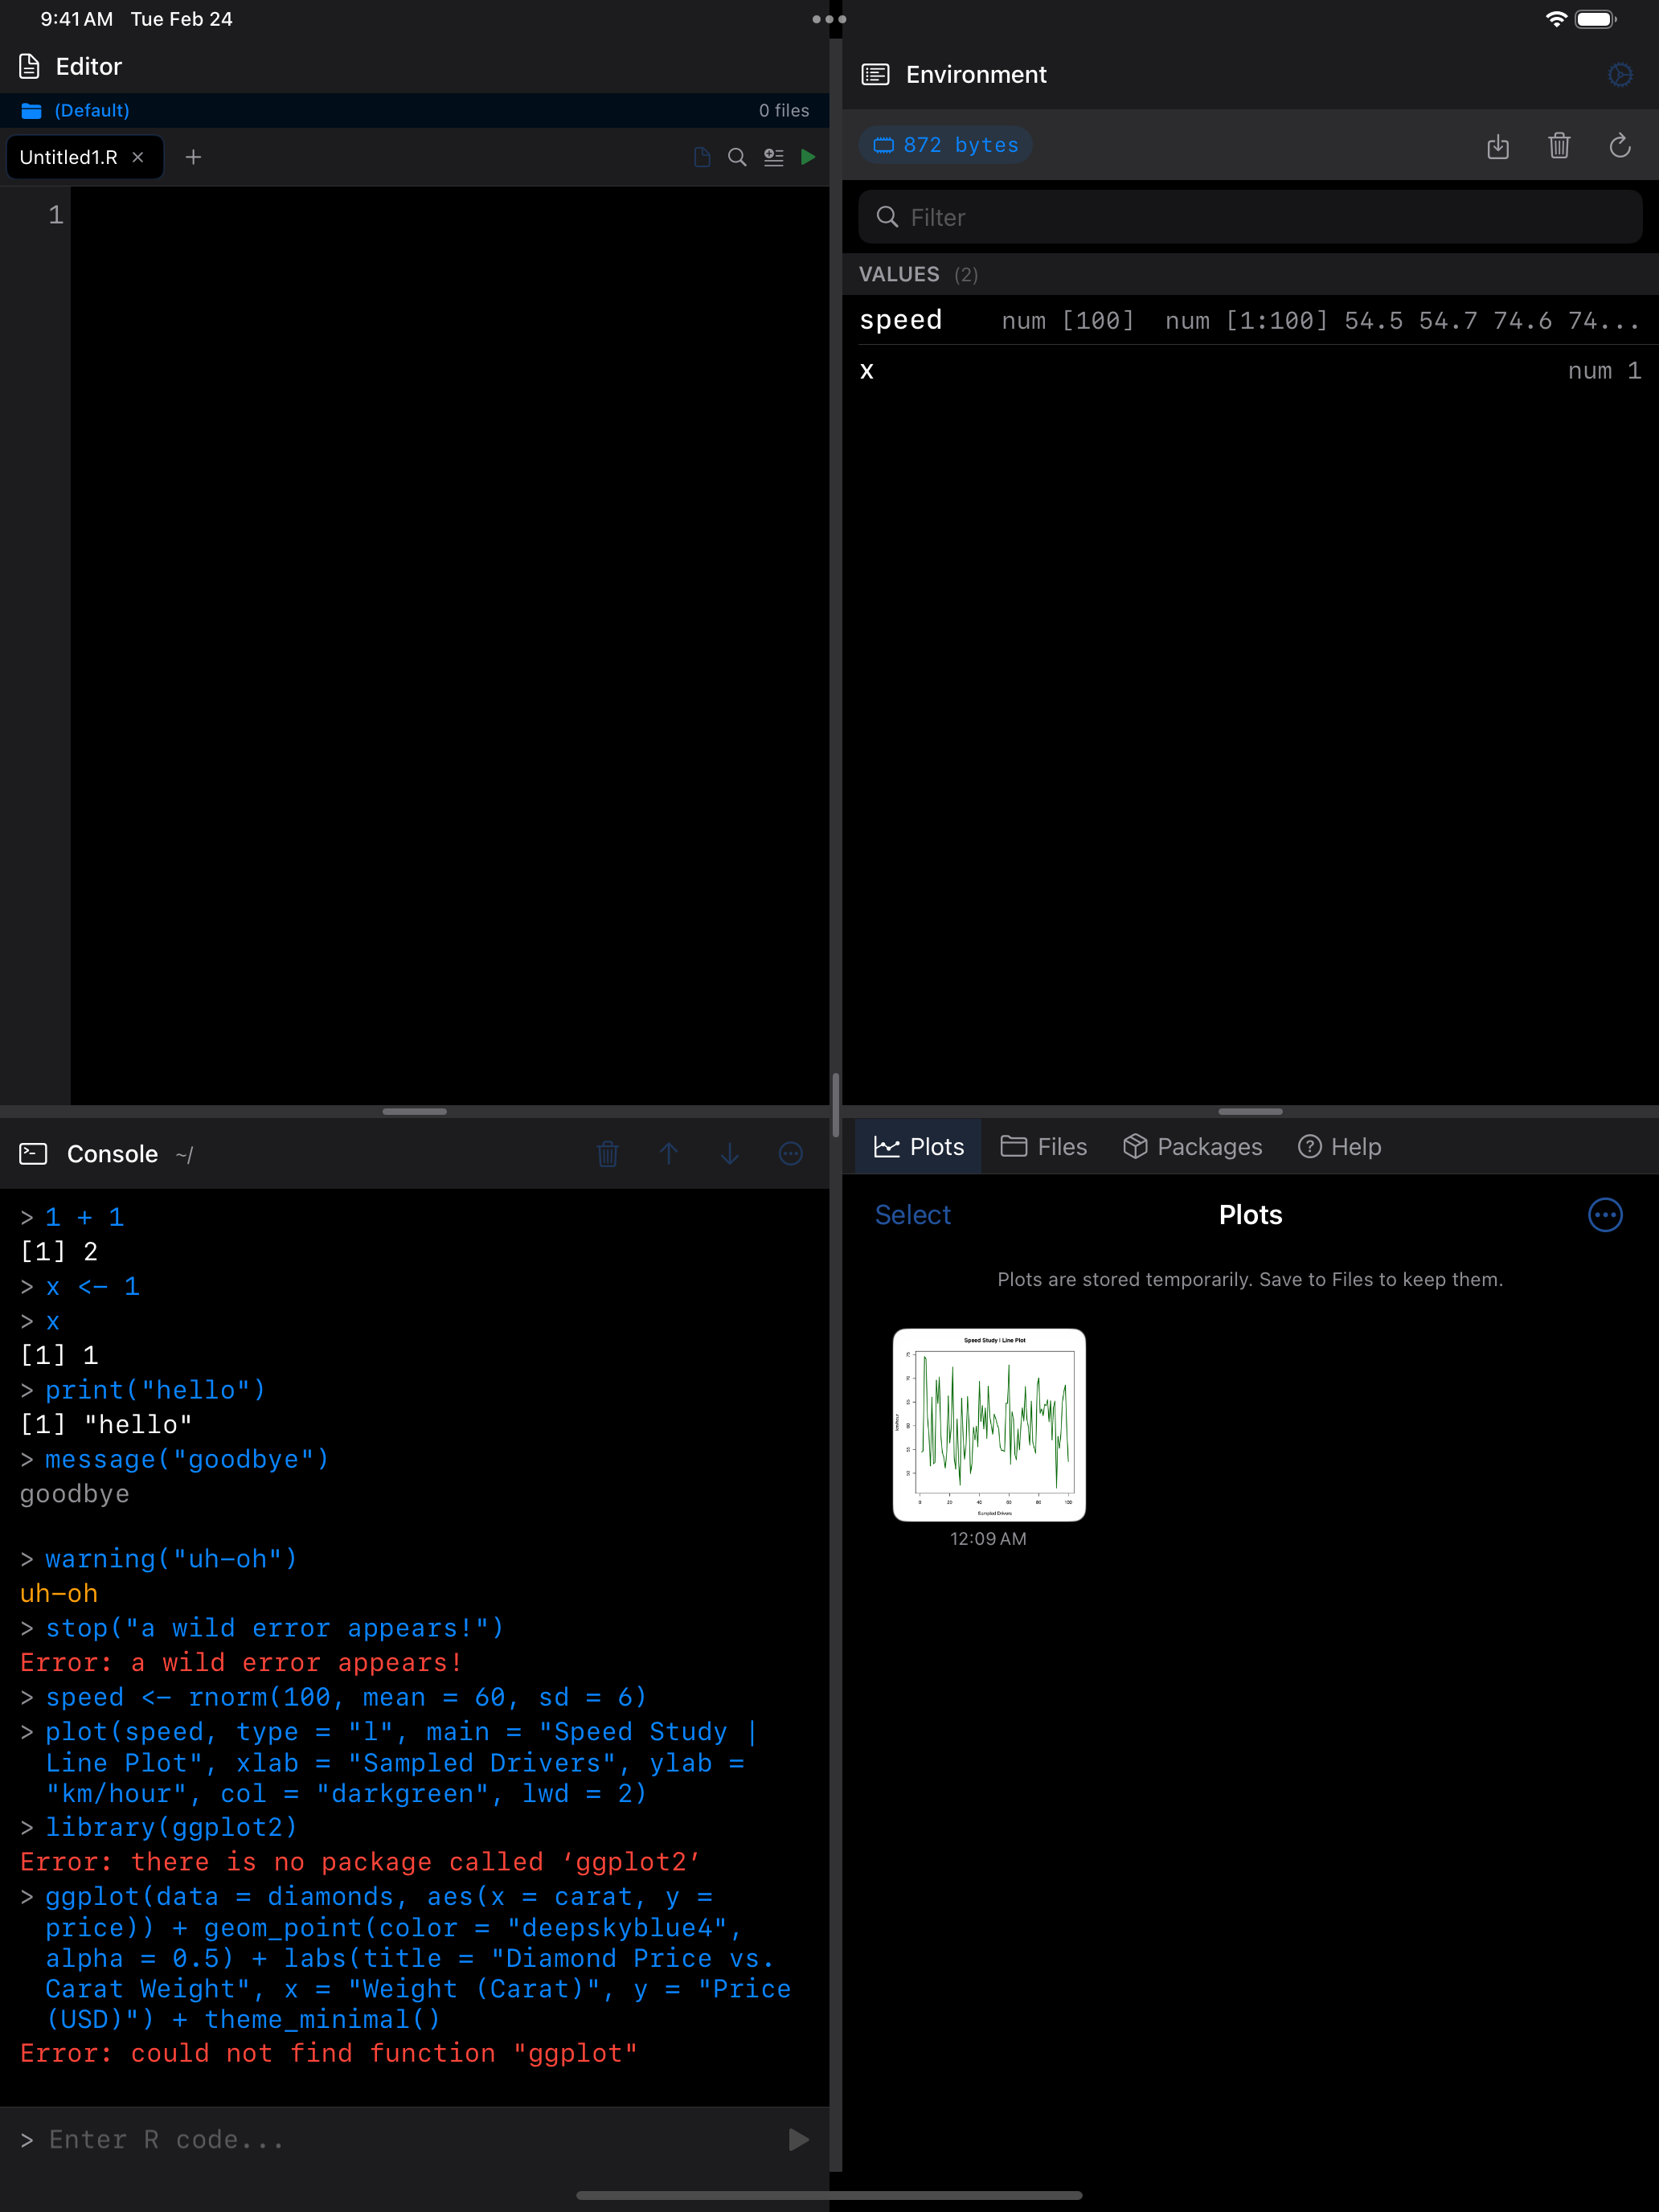
Parts of the screen
- The thumbnail grid shows each plot as a tappable card, with its creation time underneath
- The toolbar has selection mode, comparison mode and the overflow menu for managing plots
- A NEW badge briefly highlights a freshly drawn plot
Tap any thumbnail to open the full-size detail view.
Each plot is named after the line of code that drew it. VoiceOver reads the name, as in “Plot 2 from plot(mtcars$wt, mtcars$mpg)”, and the detail view uses it as its title.
Once your session has made interactive plots, an Interactive Plots card sits above the grid. See Interactive Widgets.
Viewing Plots in Detail
Tap a plot thumbnail to open it in a full-screen detail view. Three gestures move around the image.
| Gesture | Effect |
|---|---|
| Pinch | Zooms from 0.5x up to 5x |
| Drag | Pans a zoomed image |
| Double-tap | Toggles between 1x and 2x |
VoiceOver keeps pinch and double-tap for itself, so use its zoom actions (1x to 5x) and Reset zoom.
The toolbar at the top of the detail view has four actions:
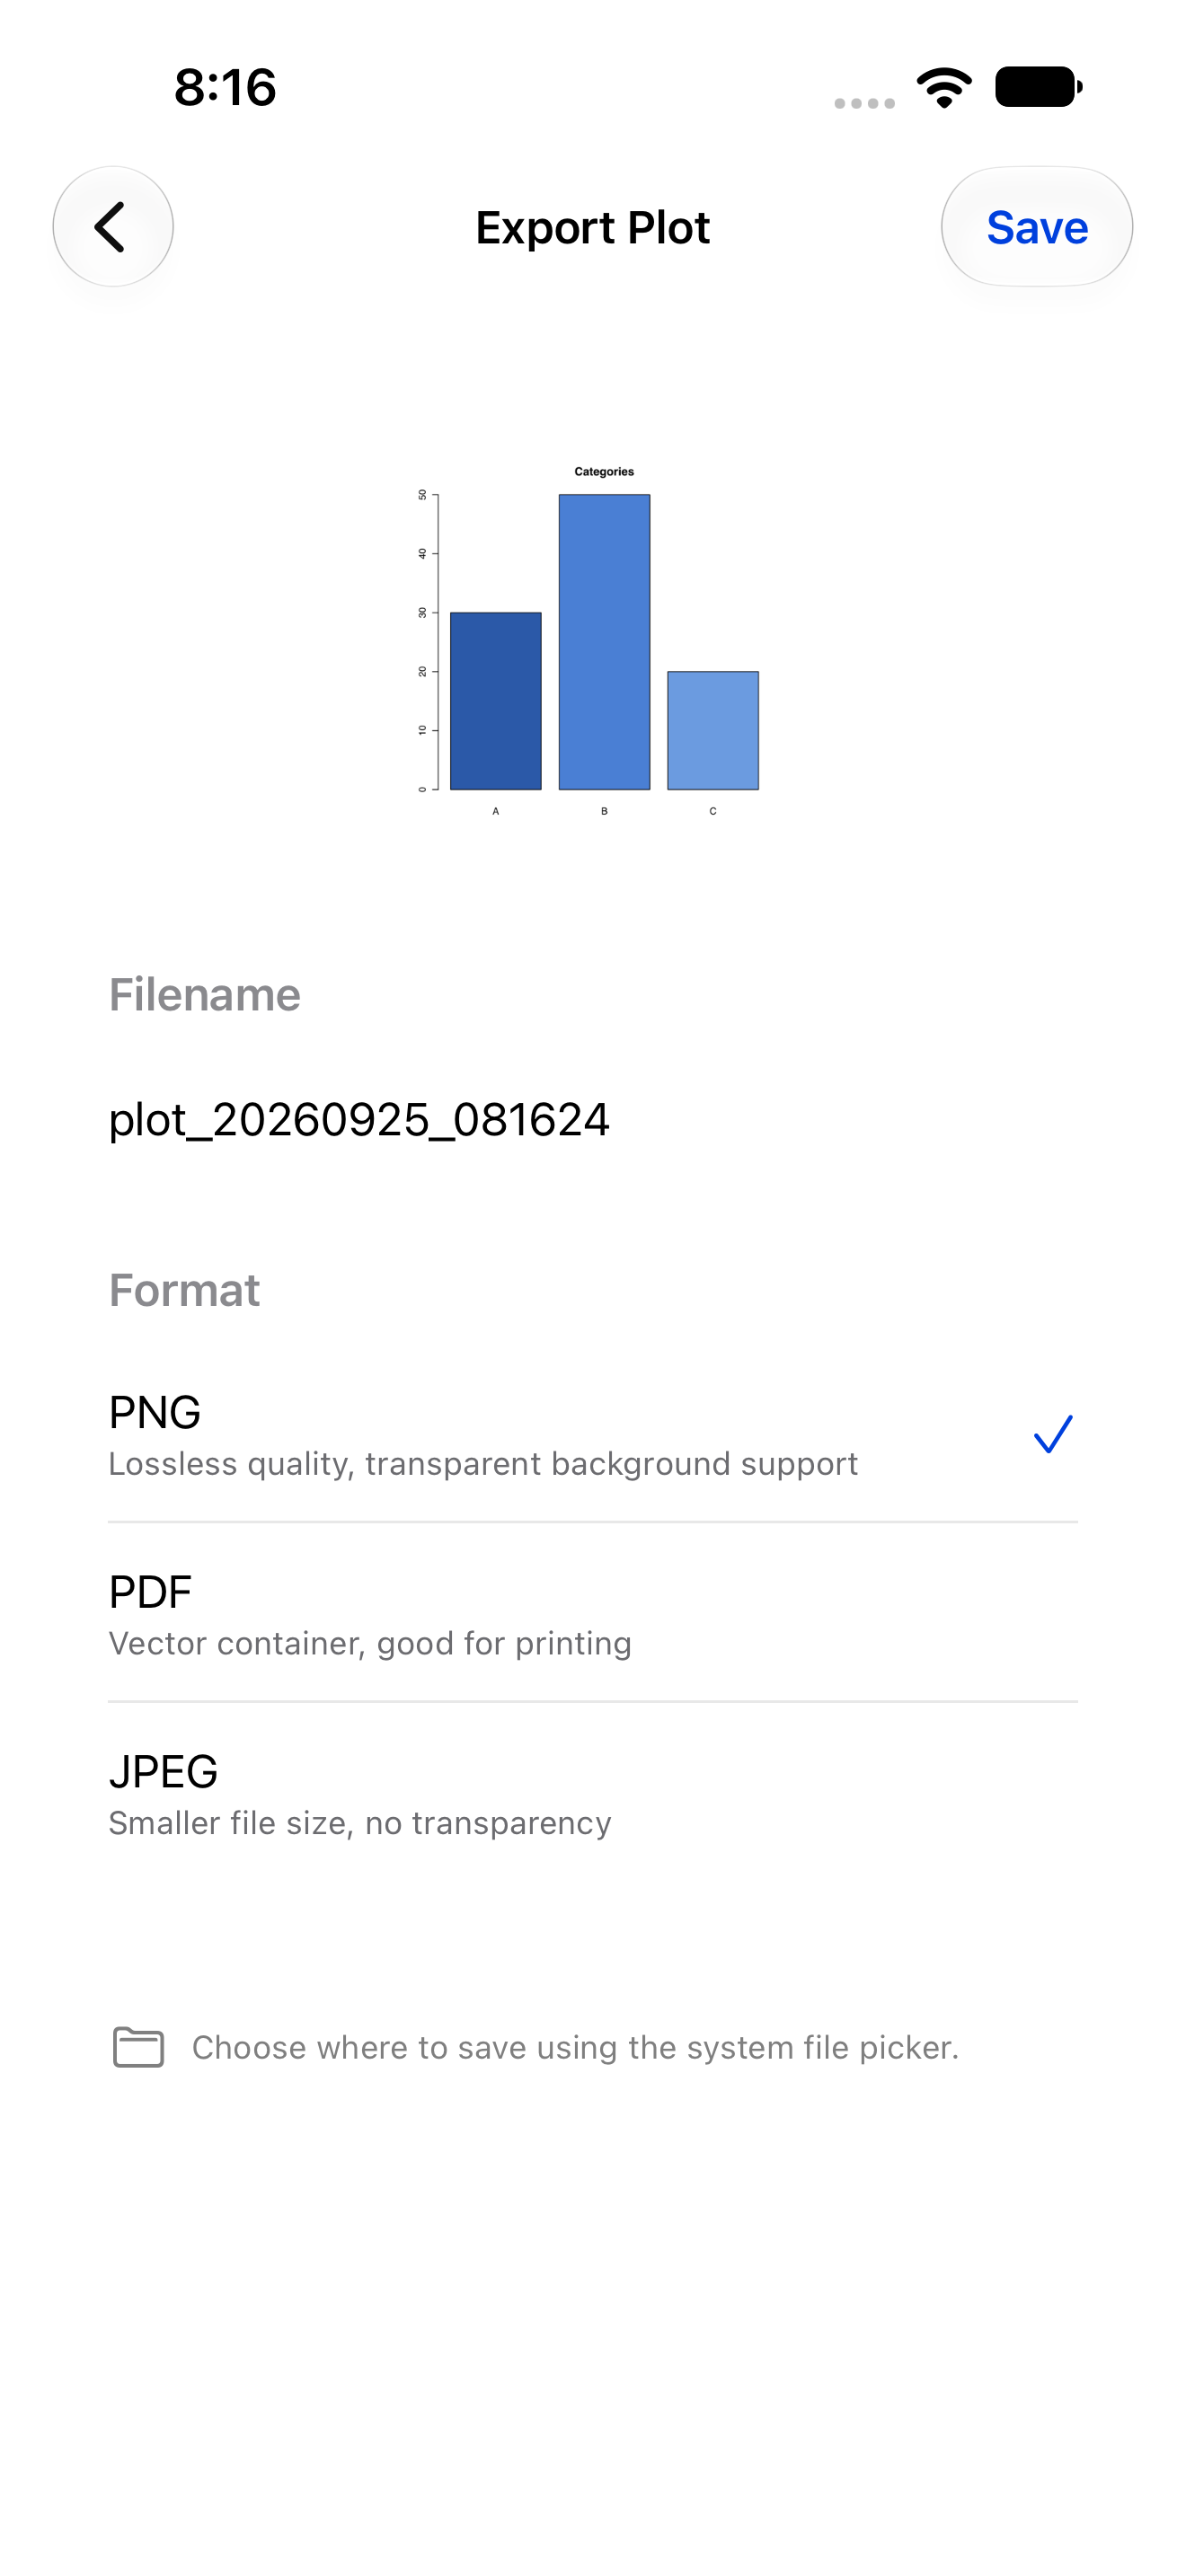
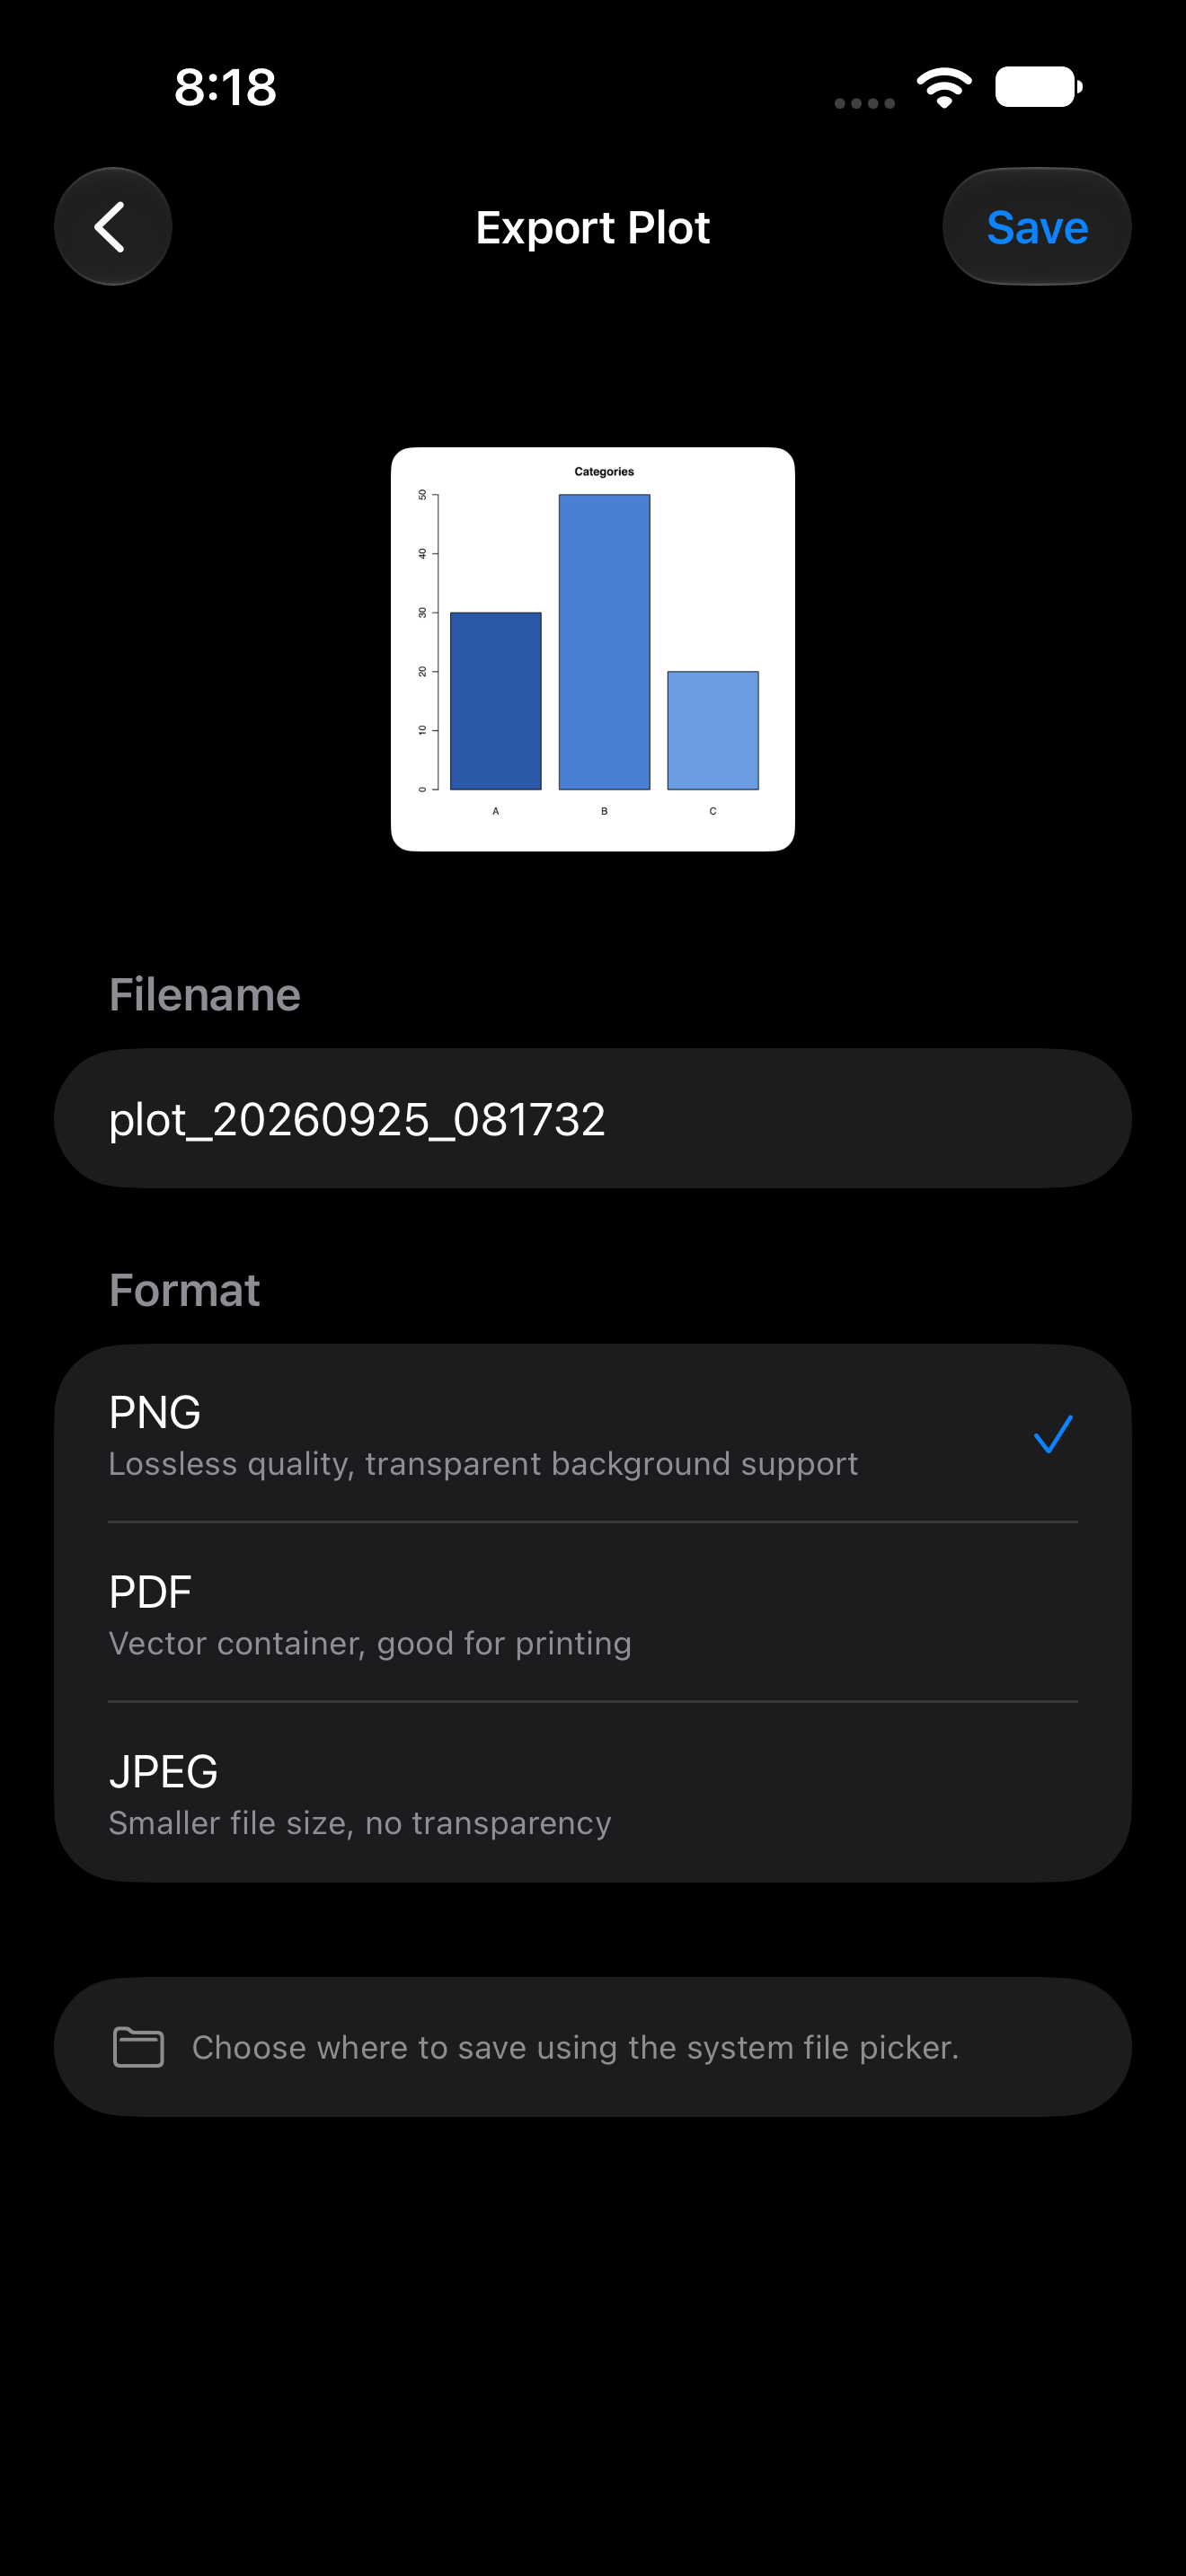
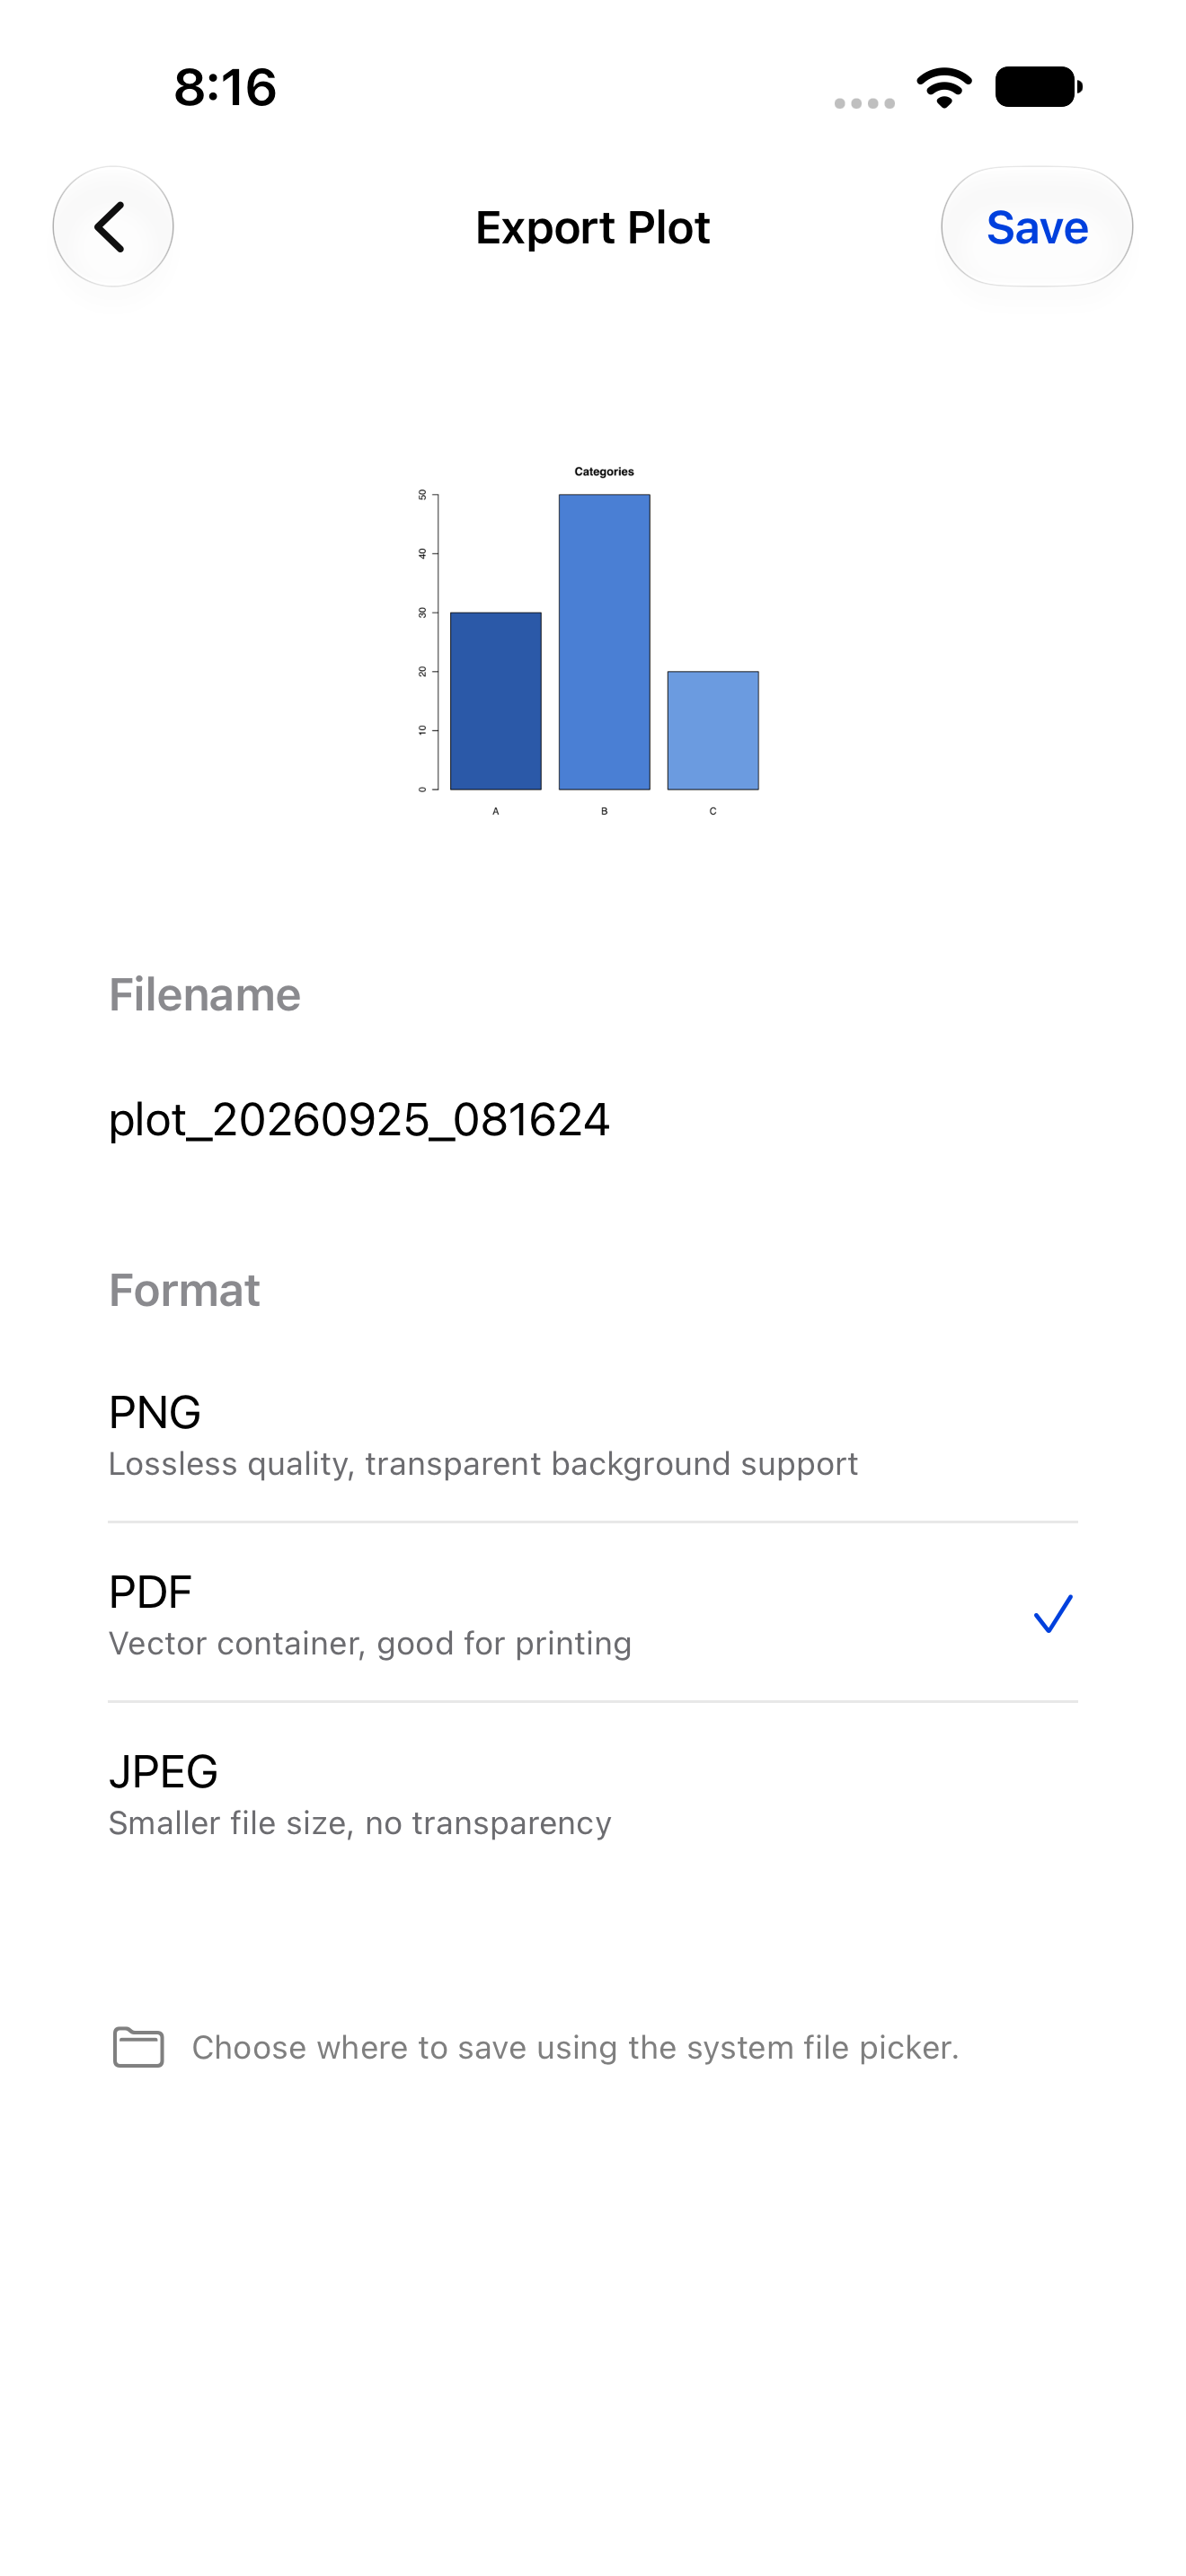
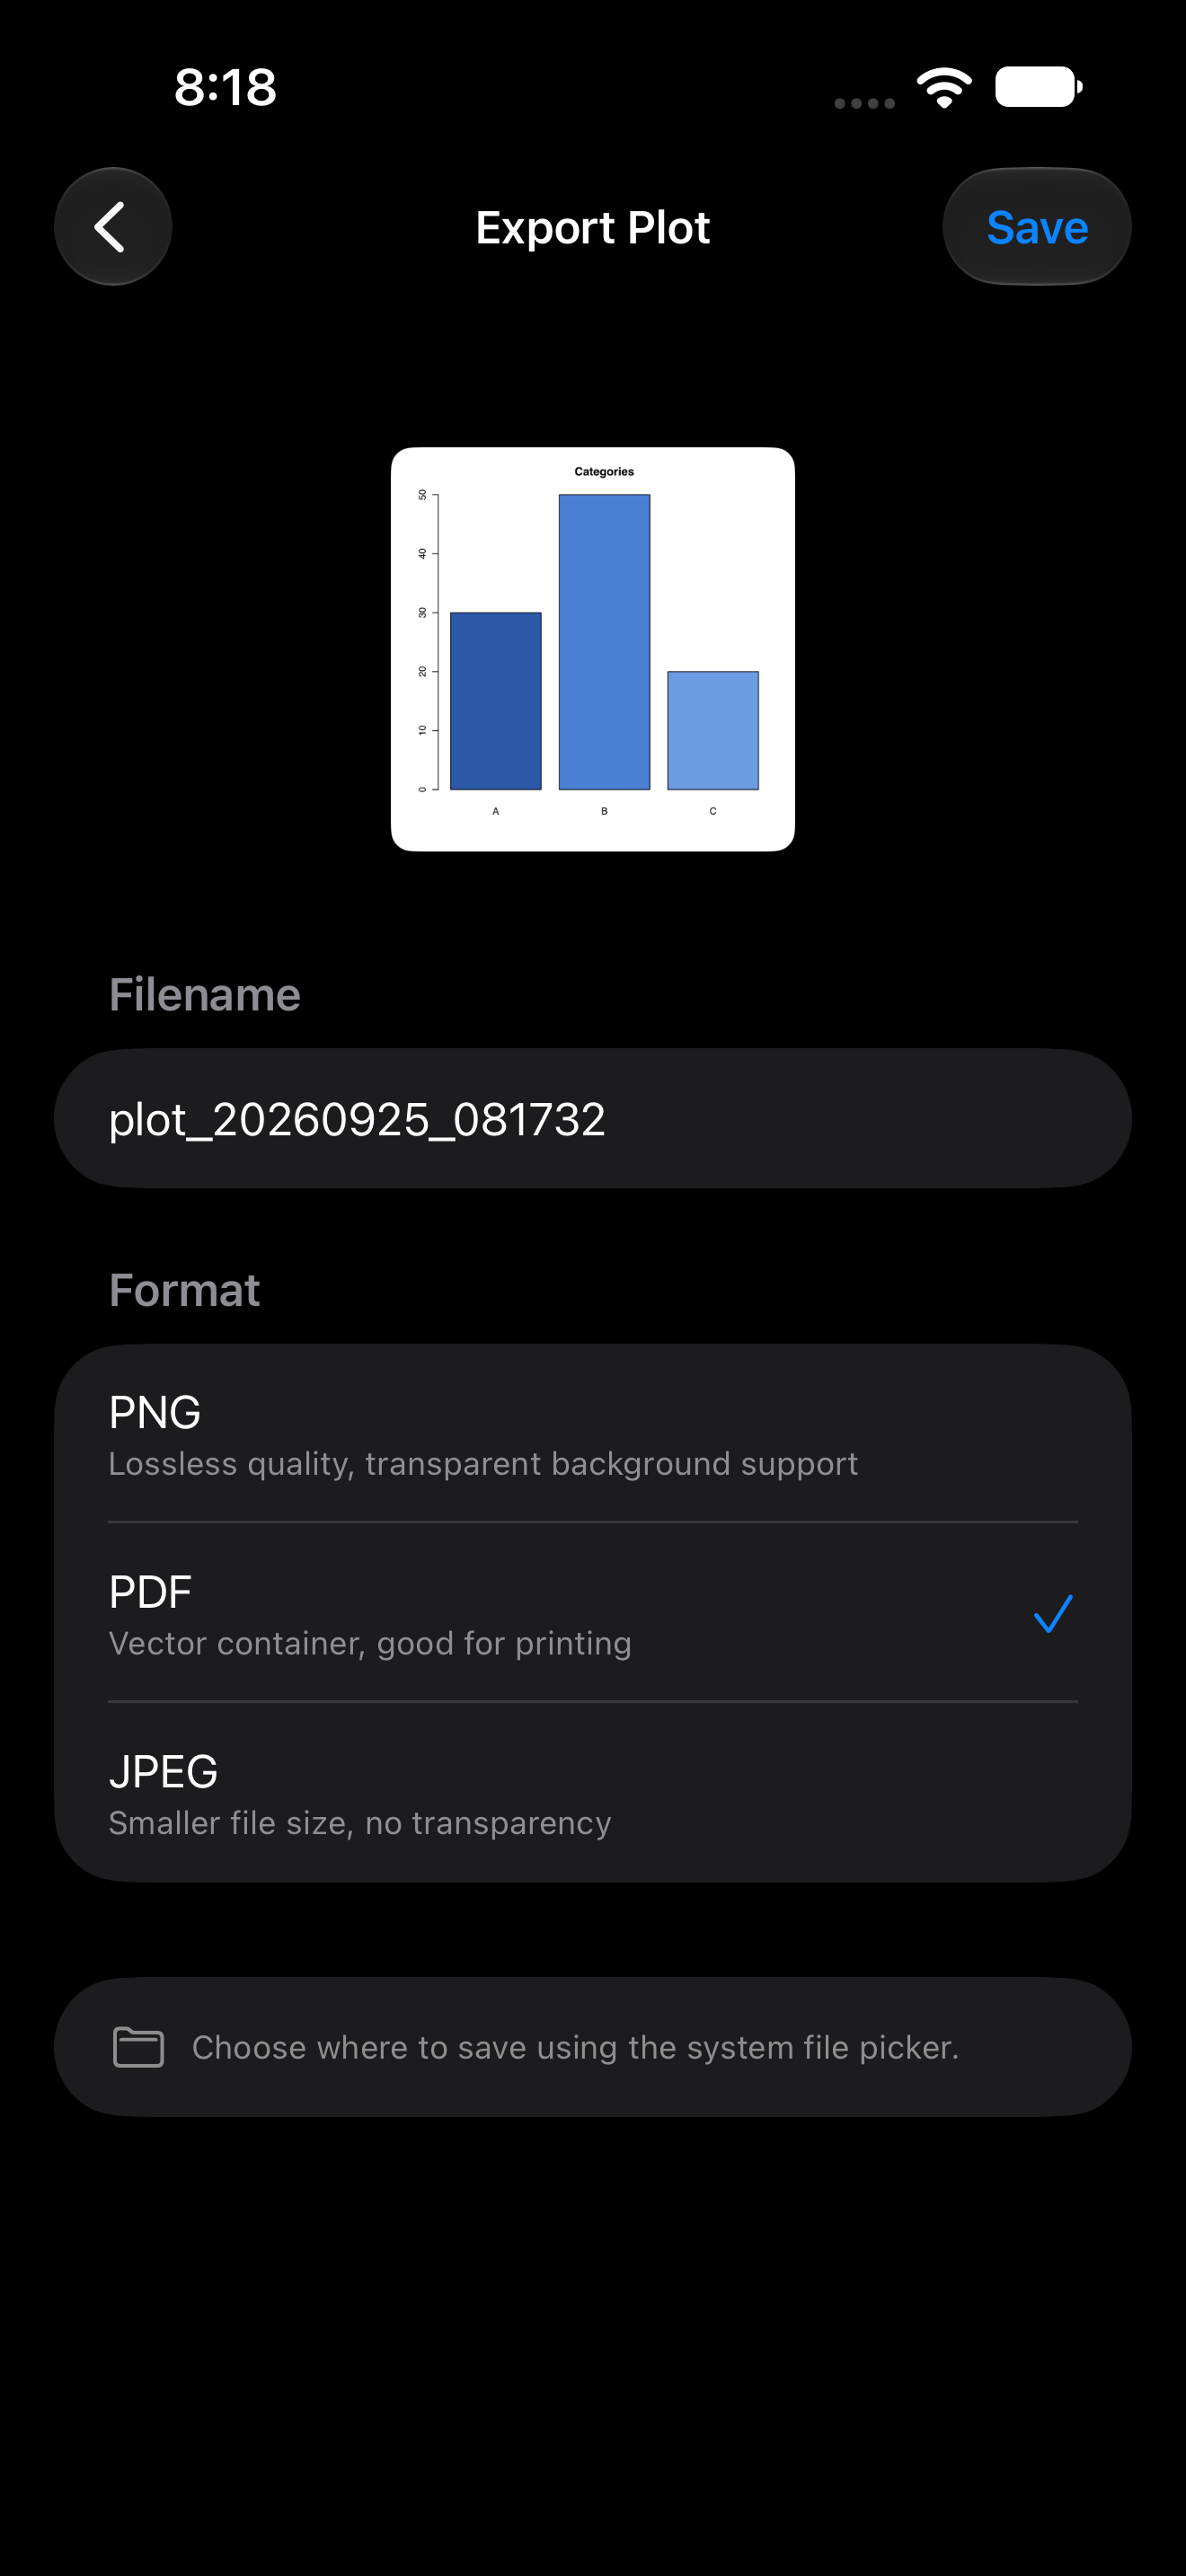
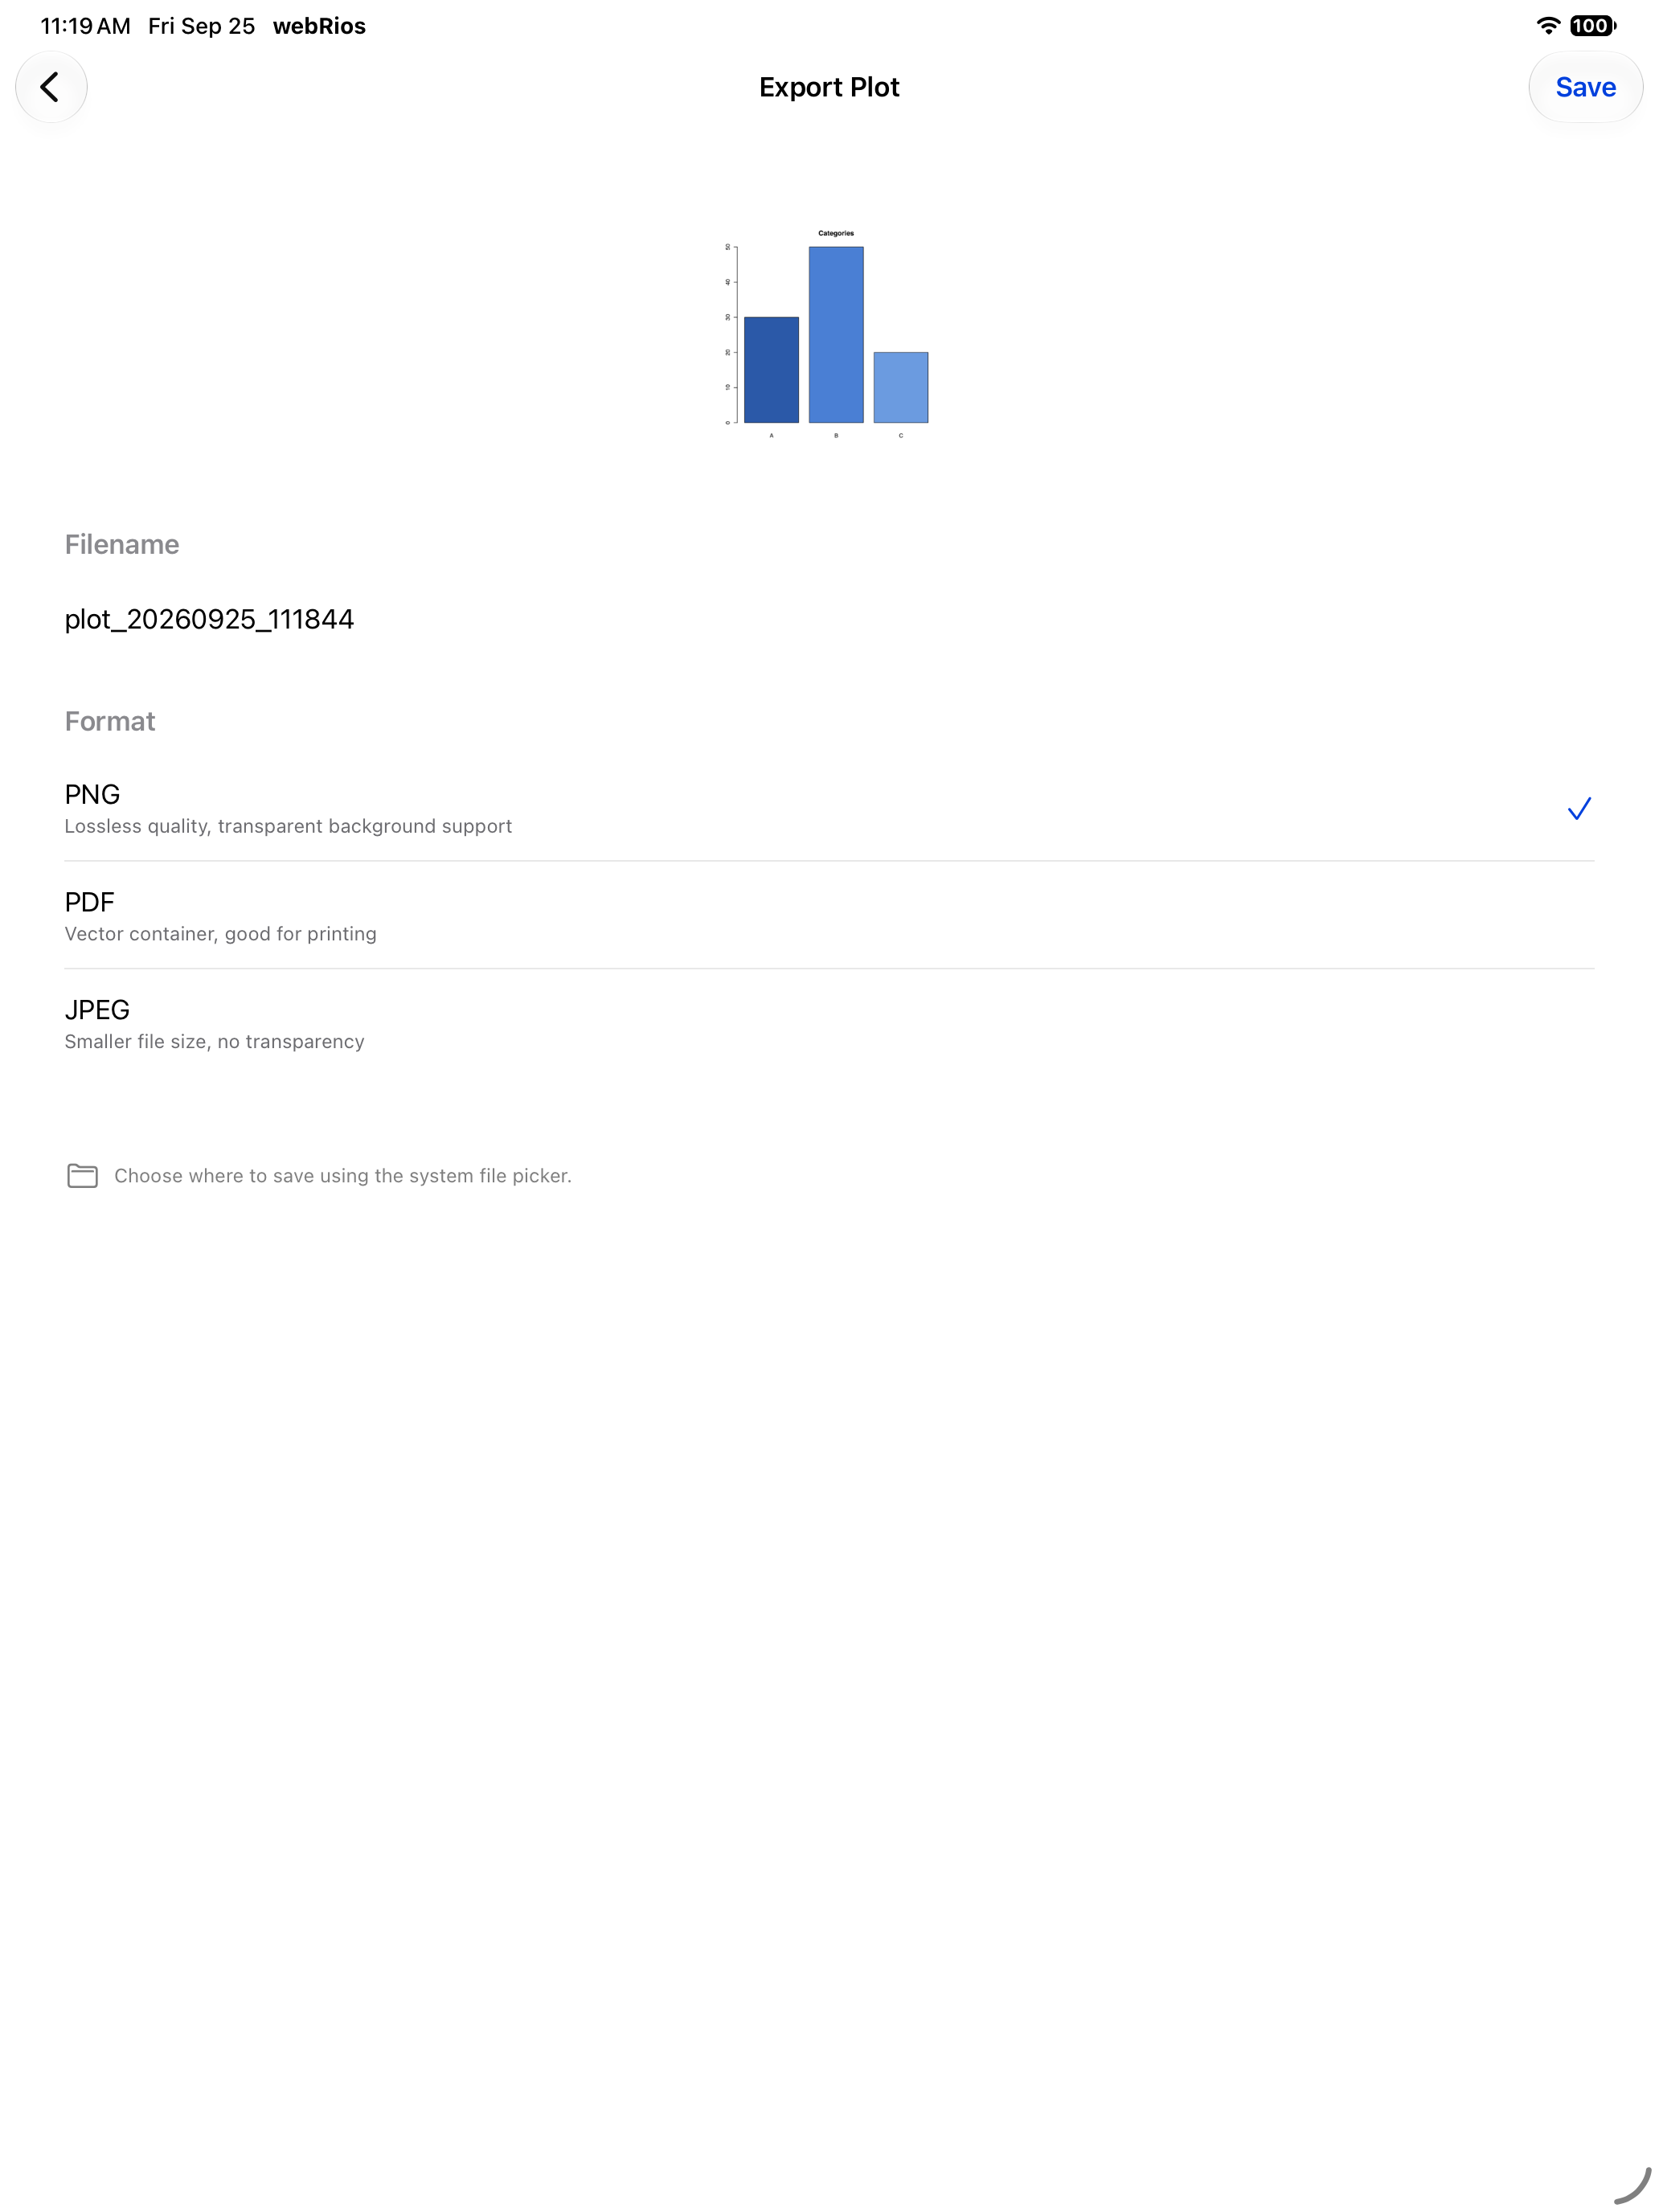
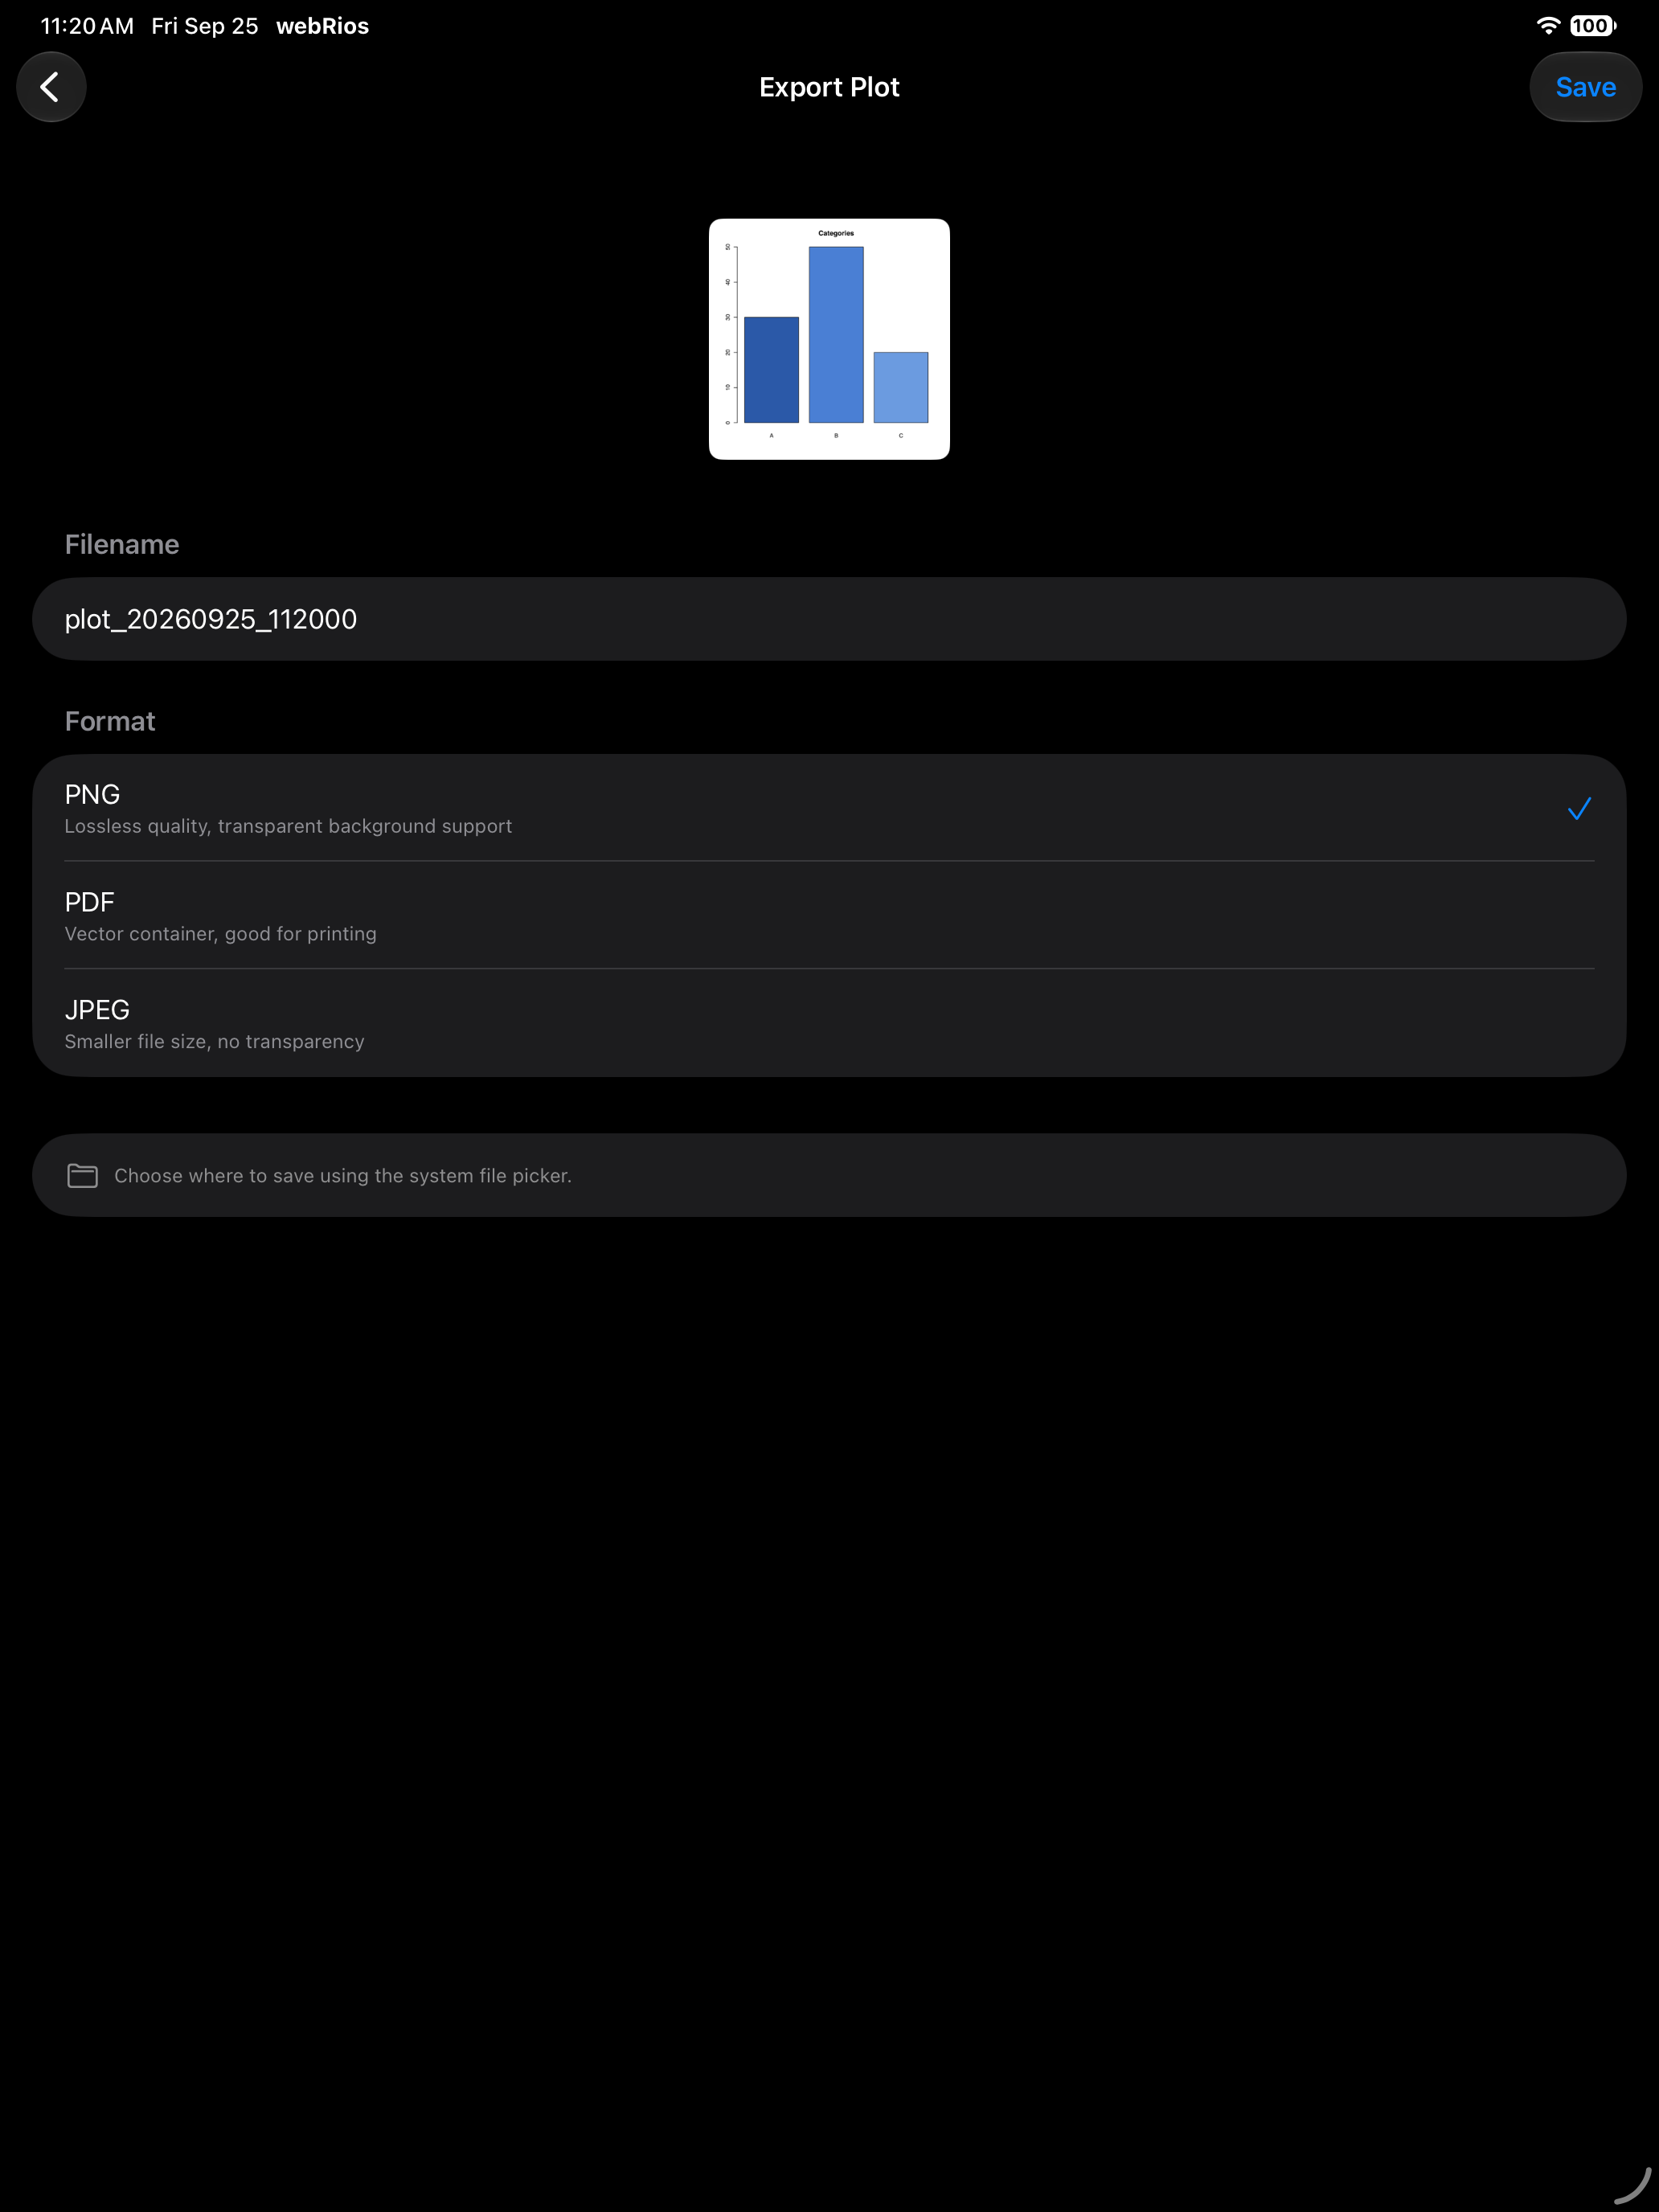
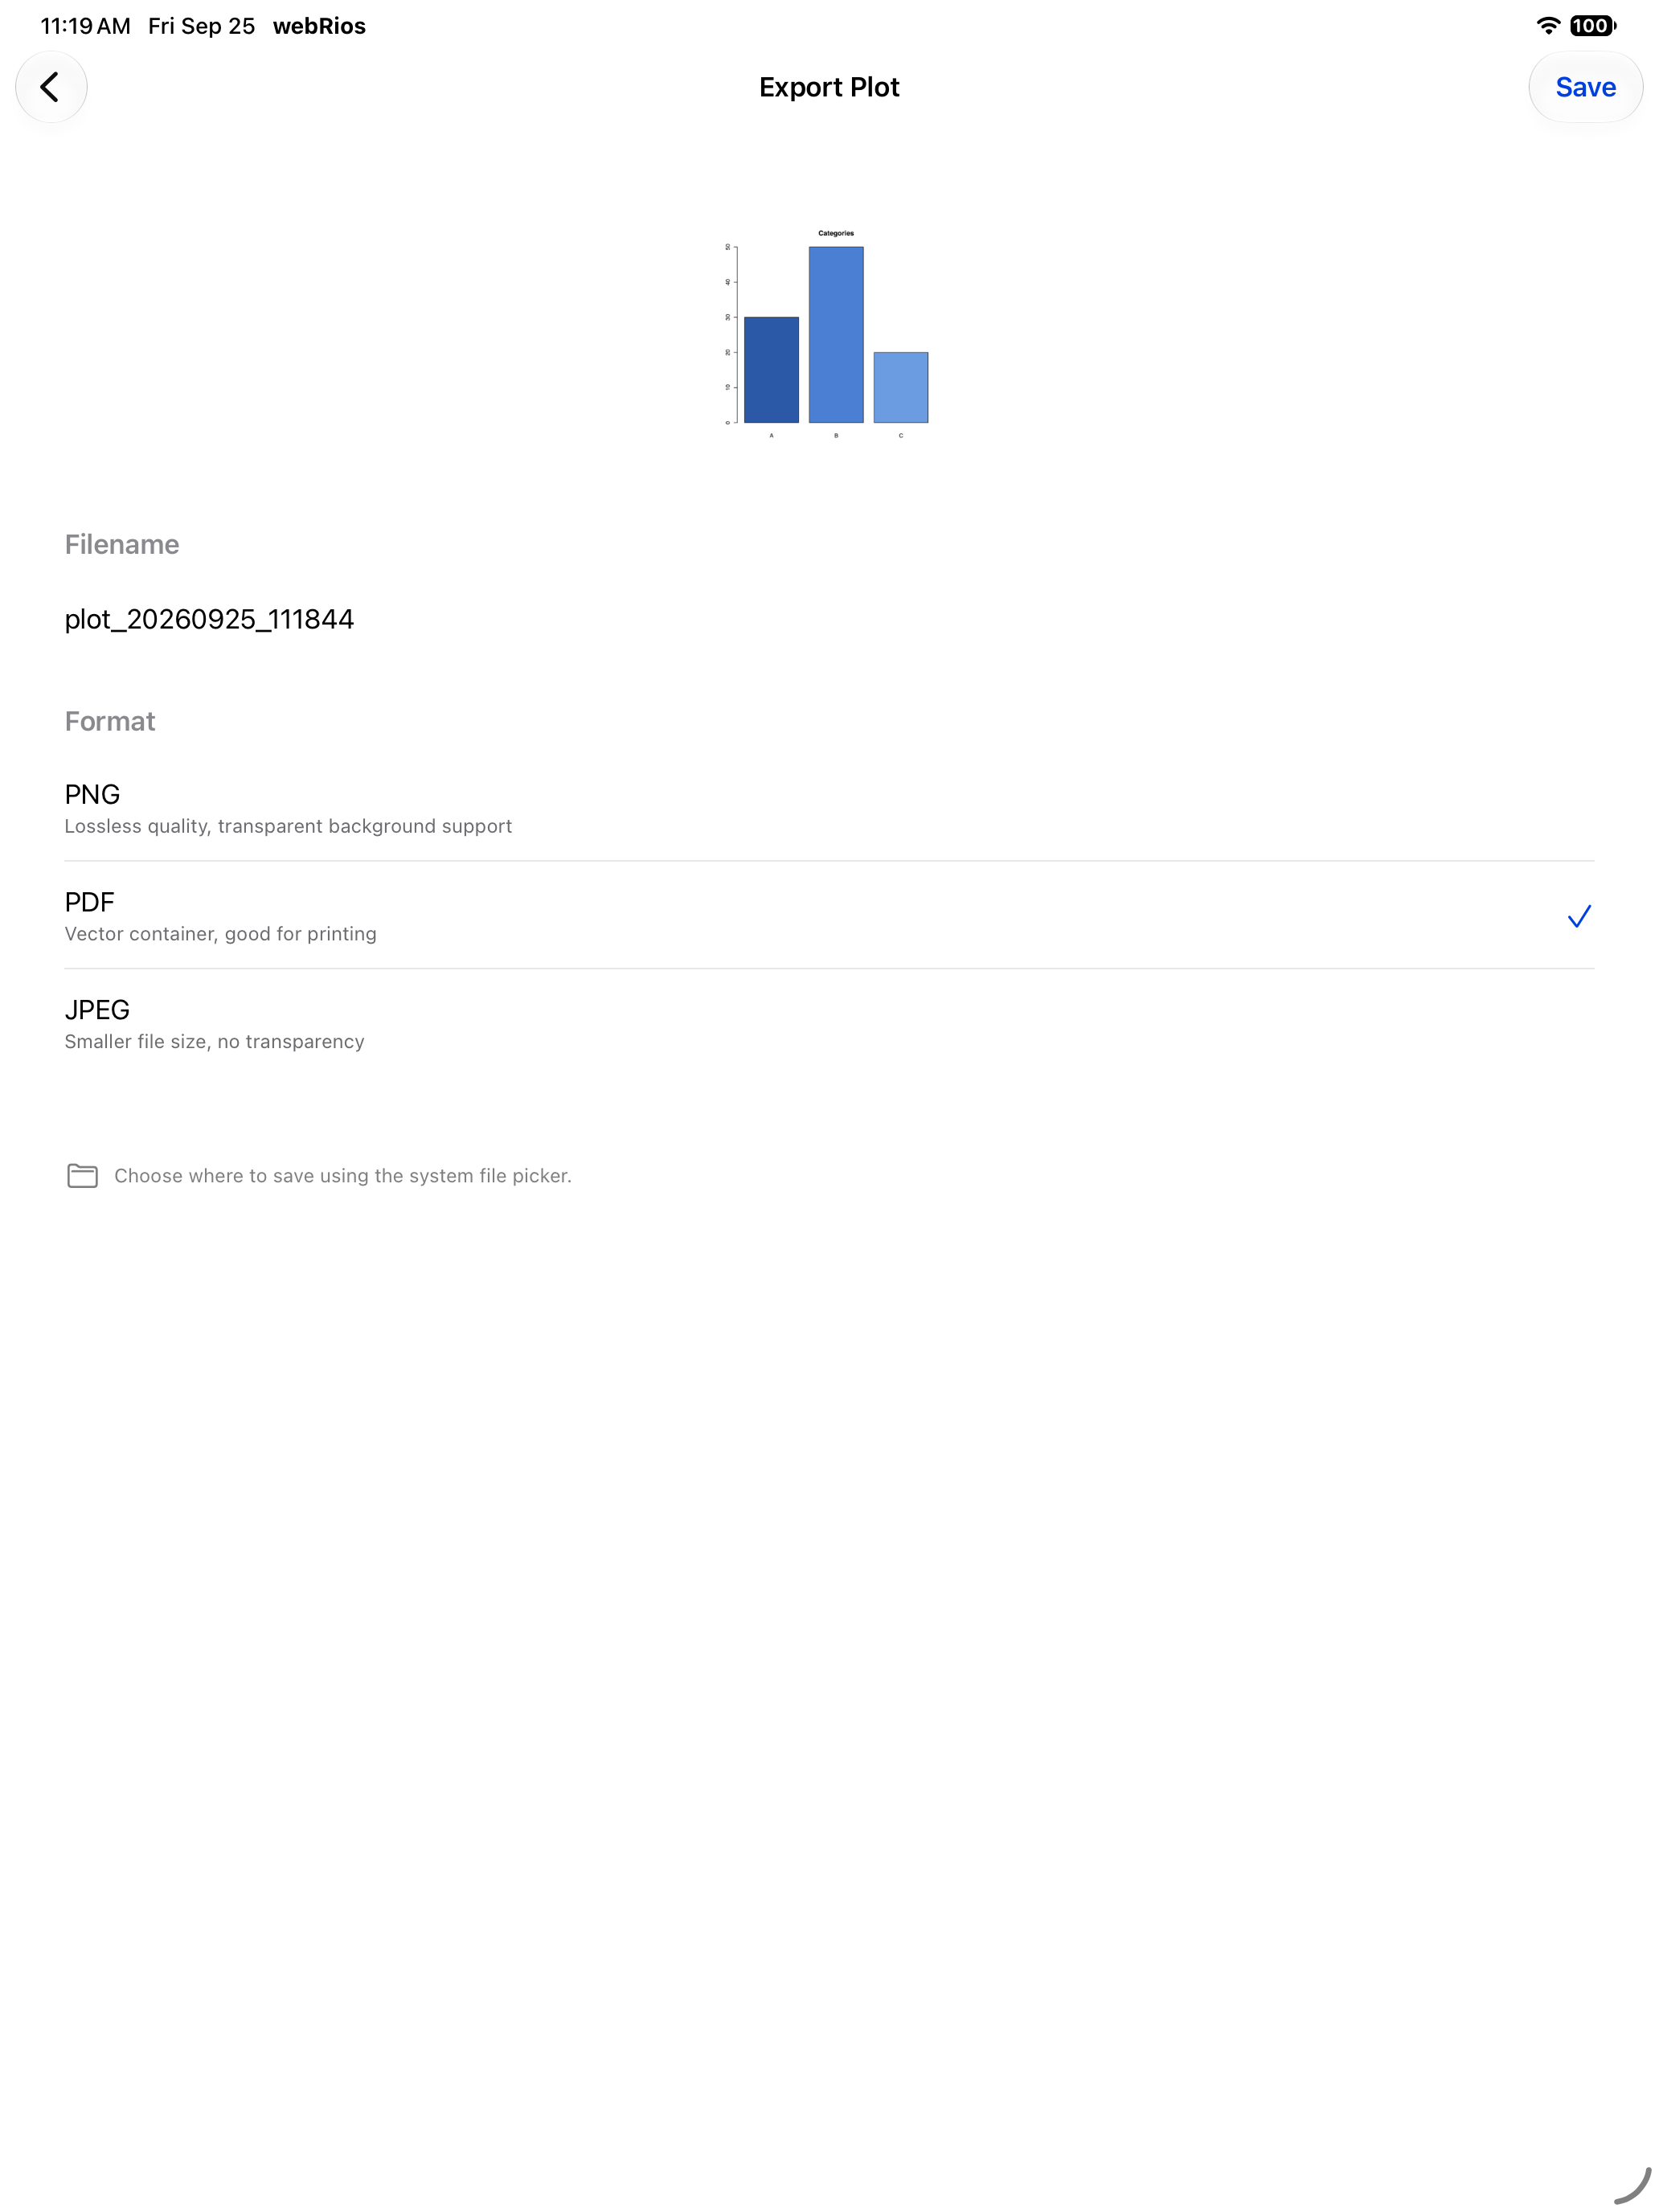
- Export saves the plot as PNG, JPEG or PDF, under a filename you choose
- Share sends the plot through the iOS share sheet to Photos, AirDrop, Mail, Messages or any app that accepts images
- Delete removes the plot from the gallery, unless it is pinned
- Open in new window, on iPad only, puts the plot in its own window beside your code
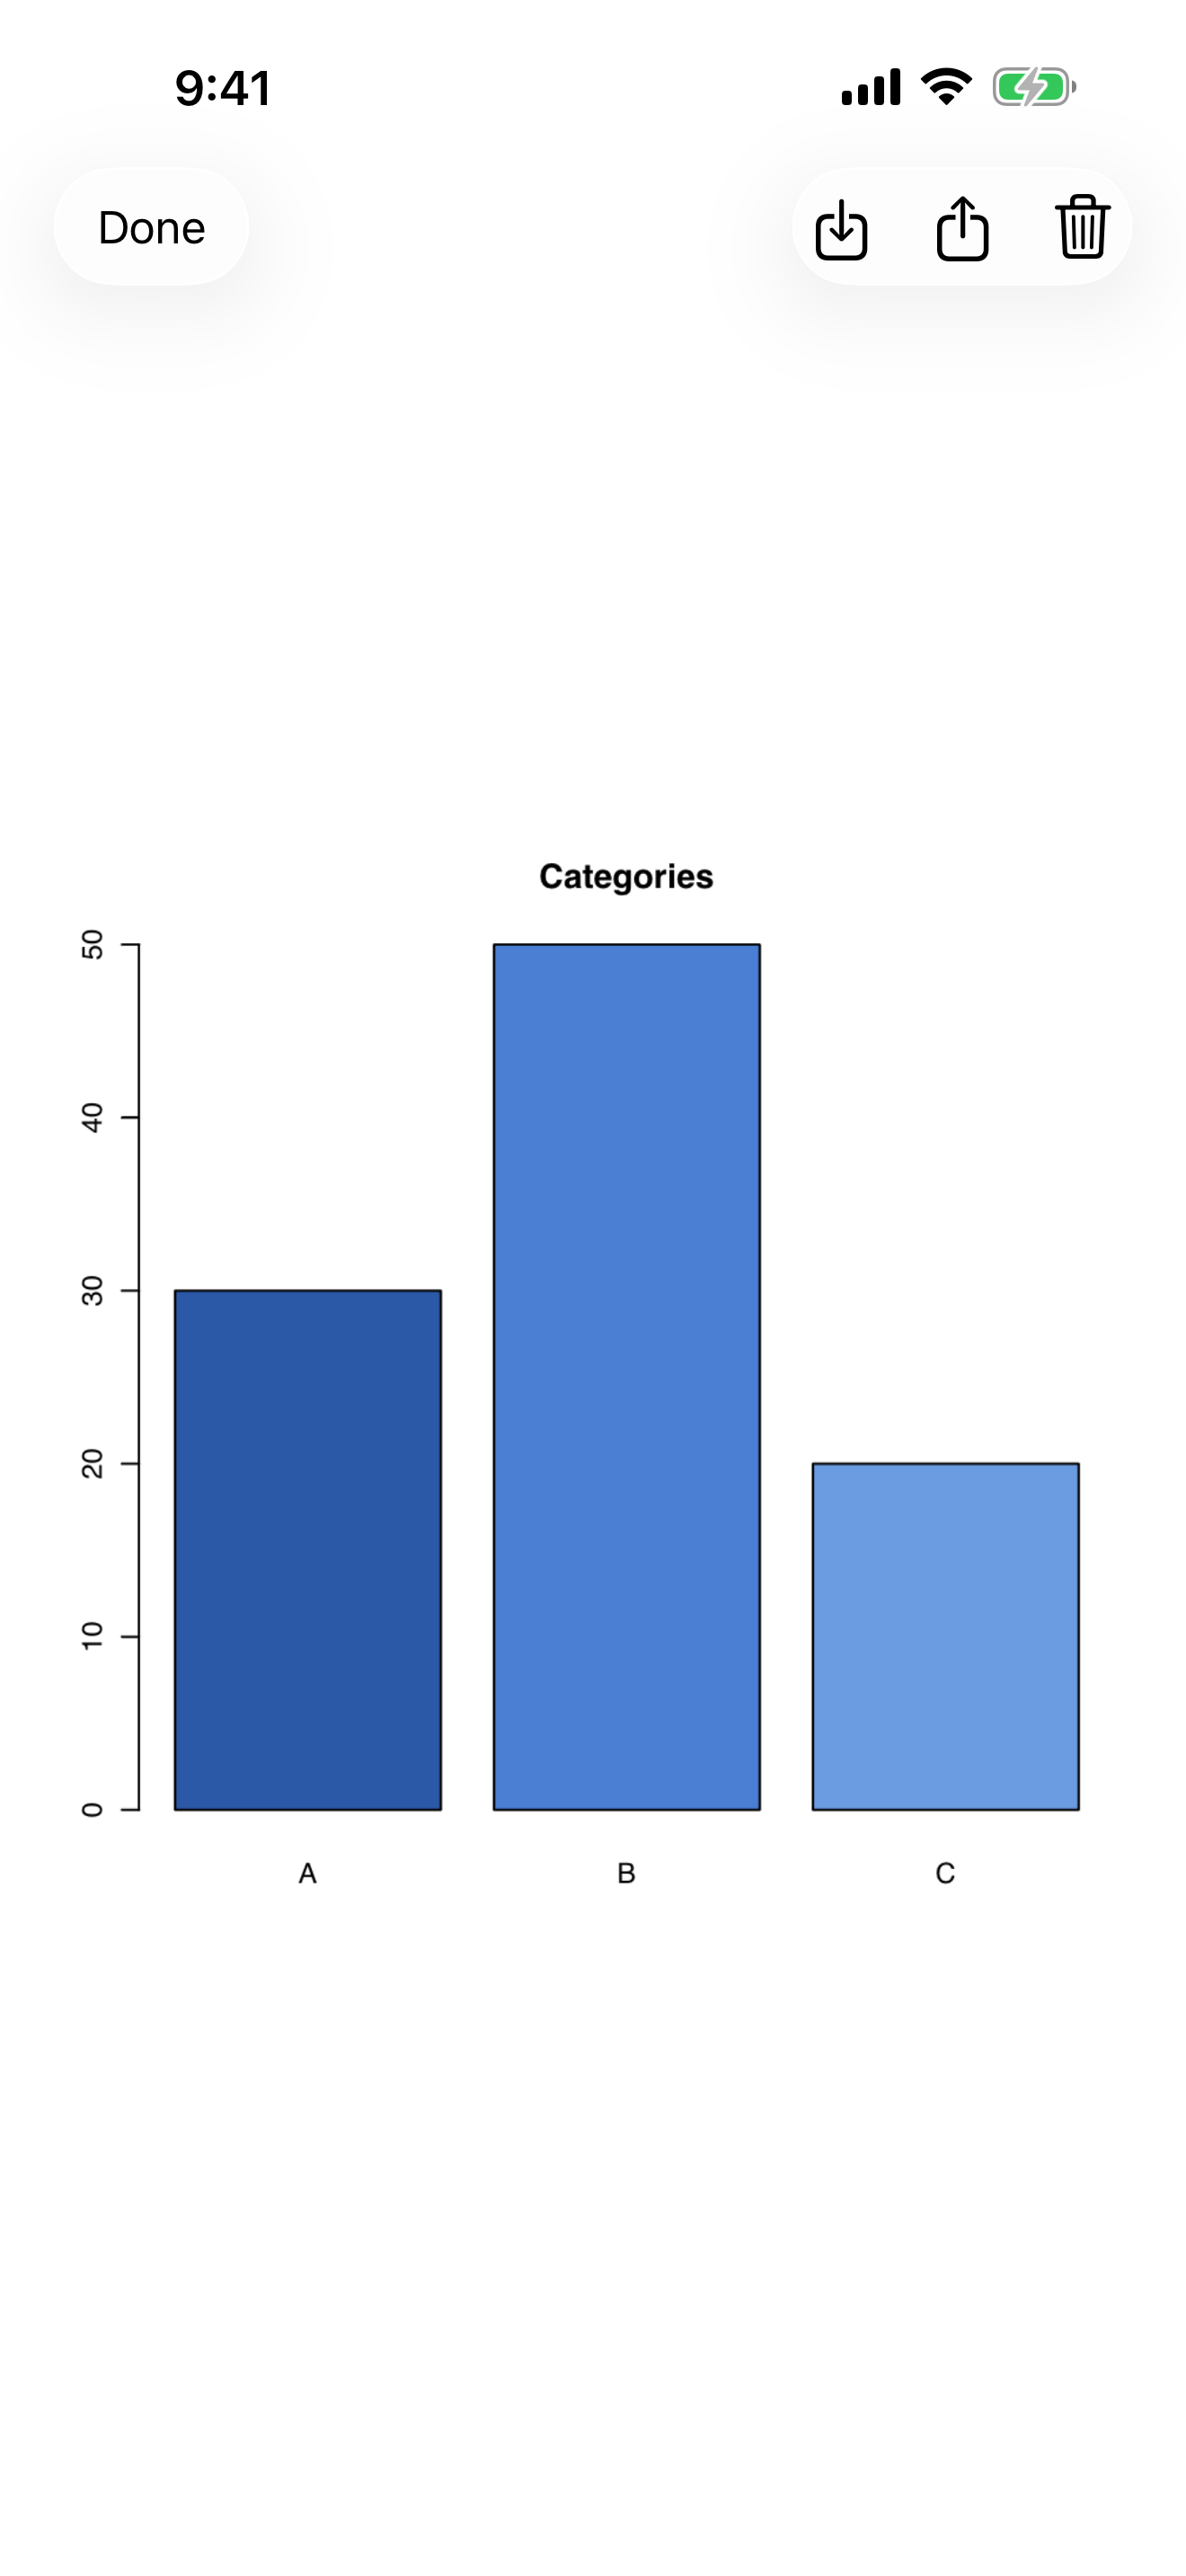
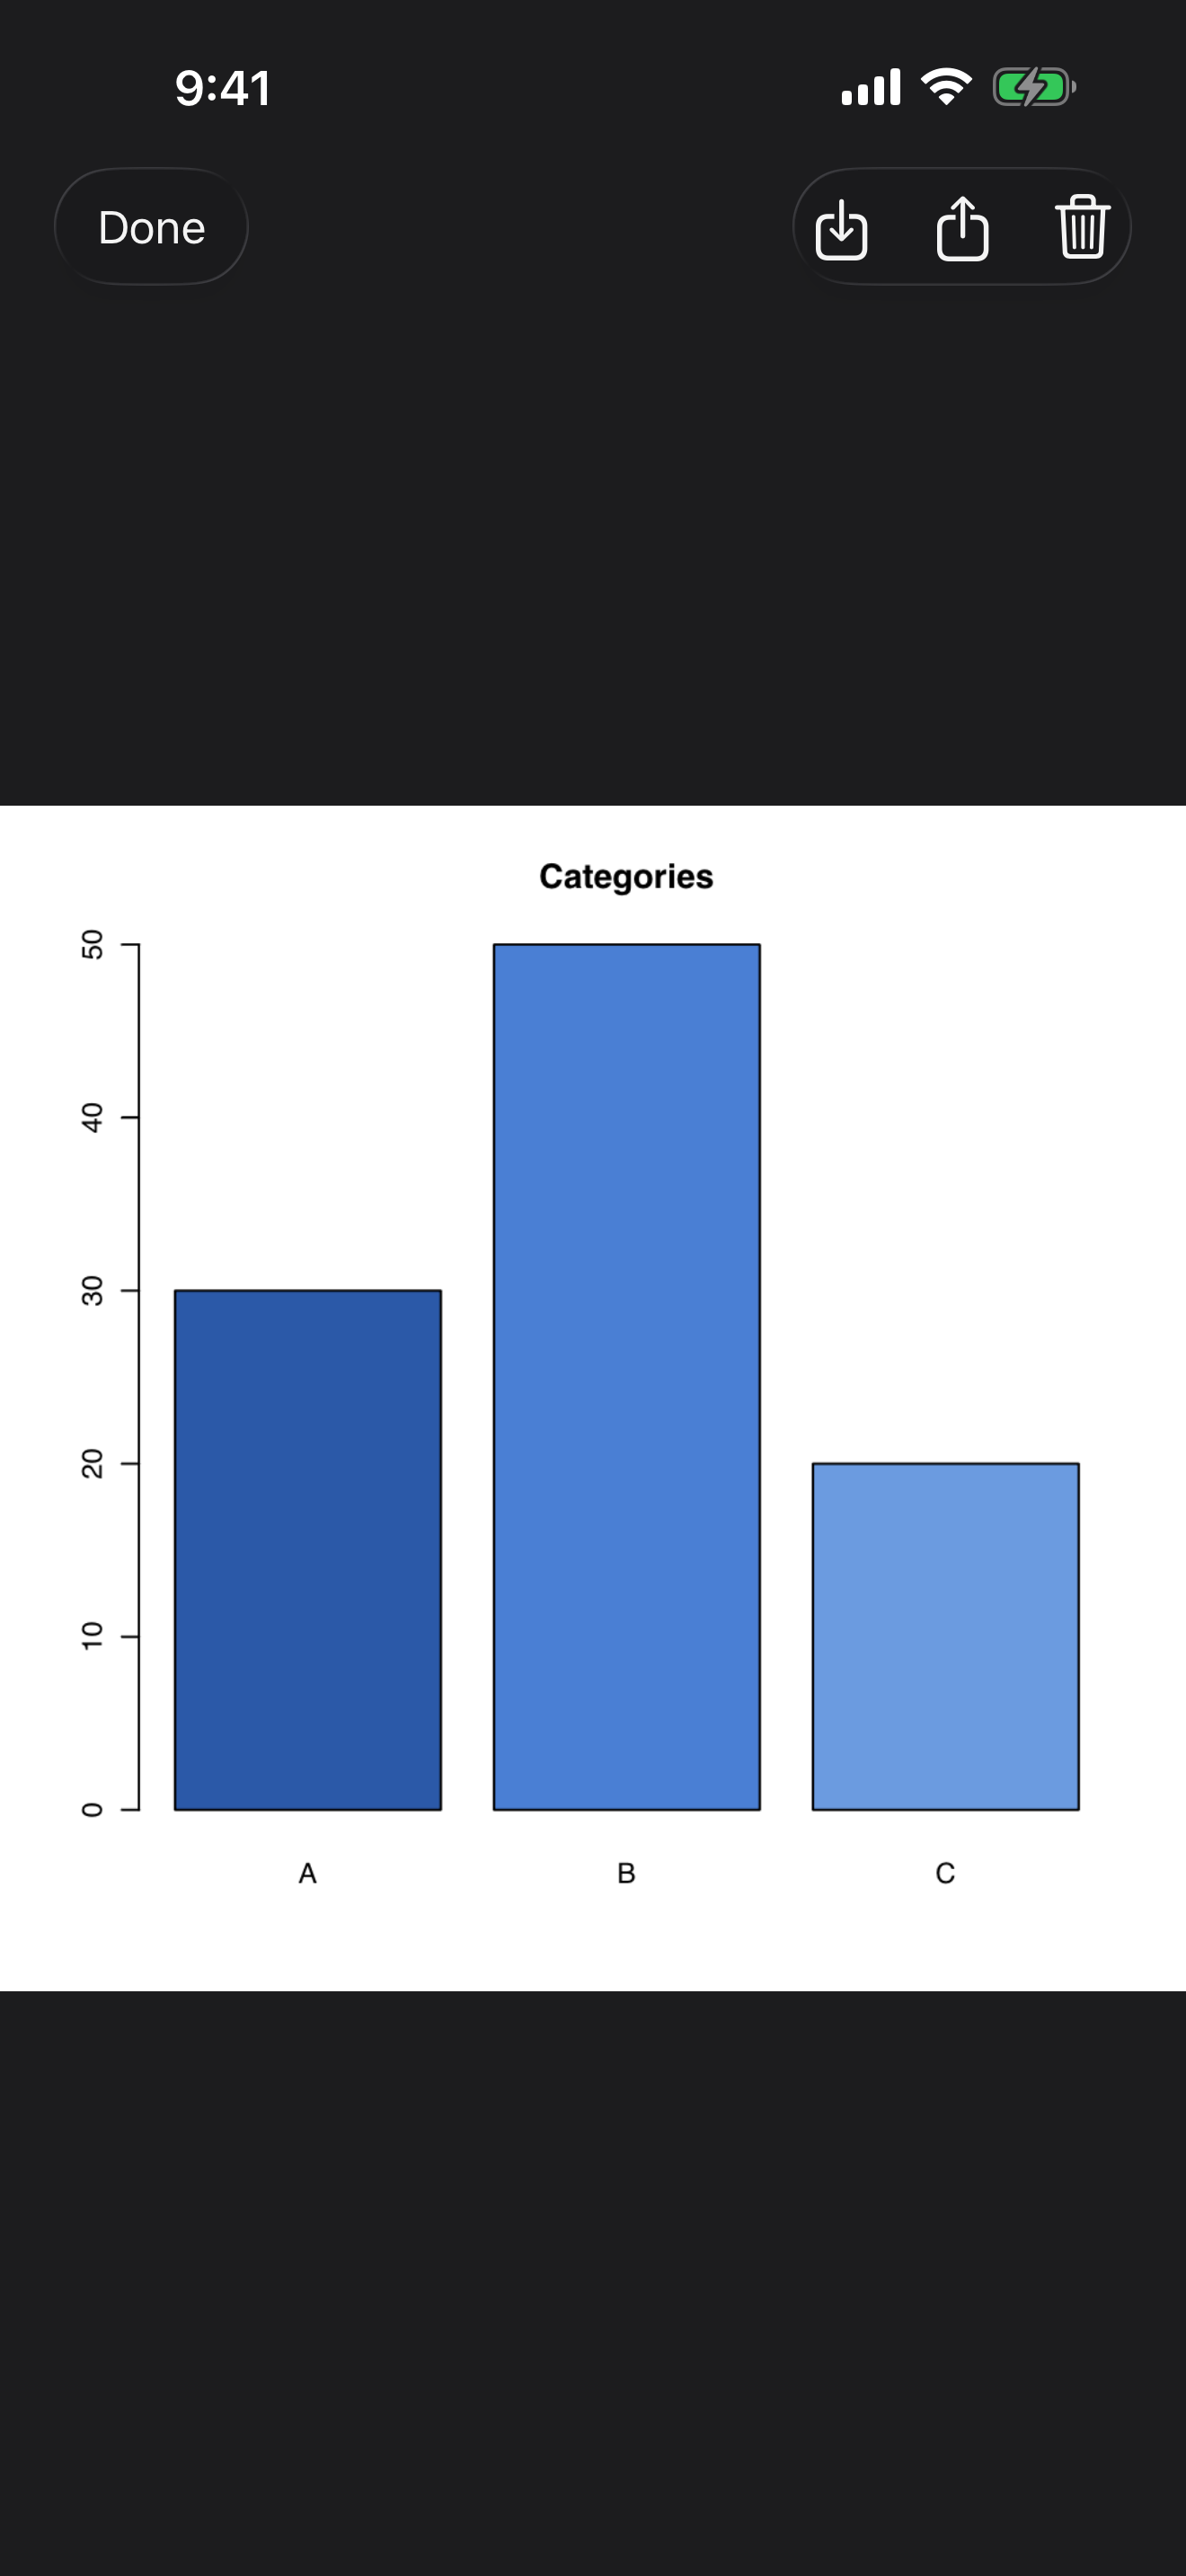
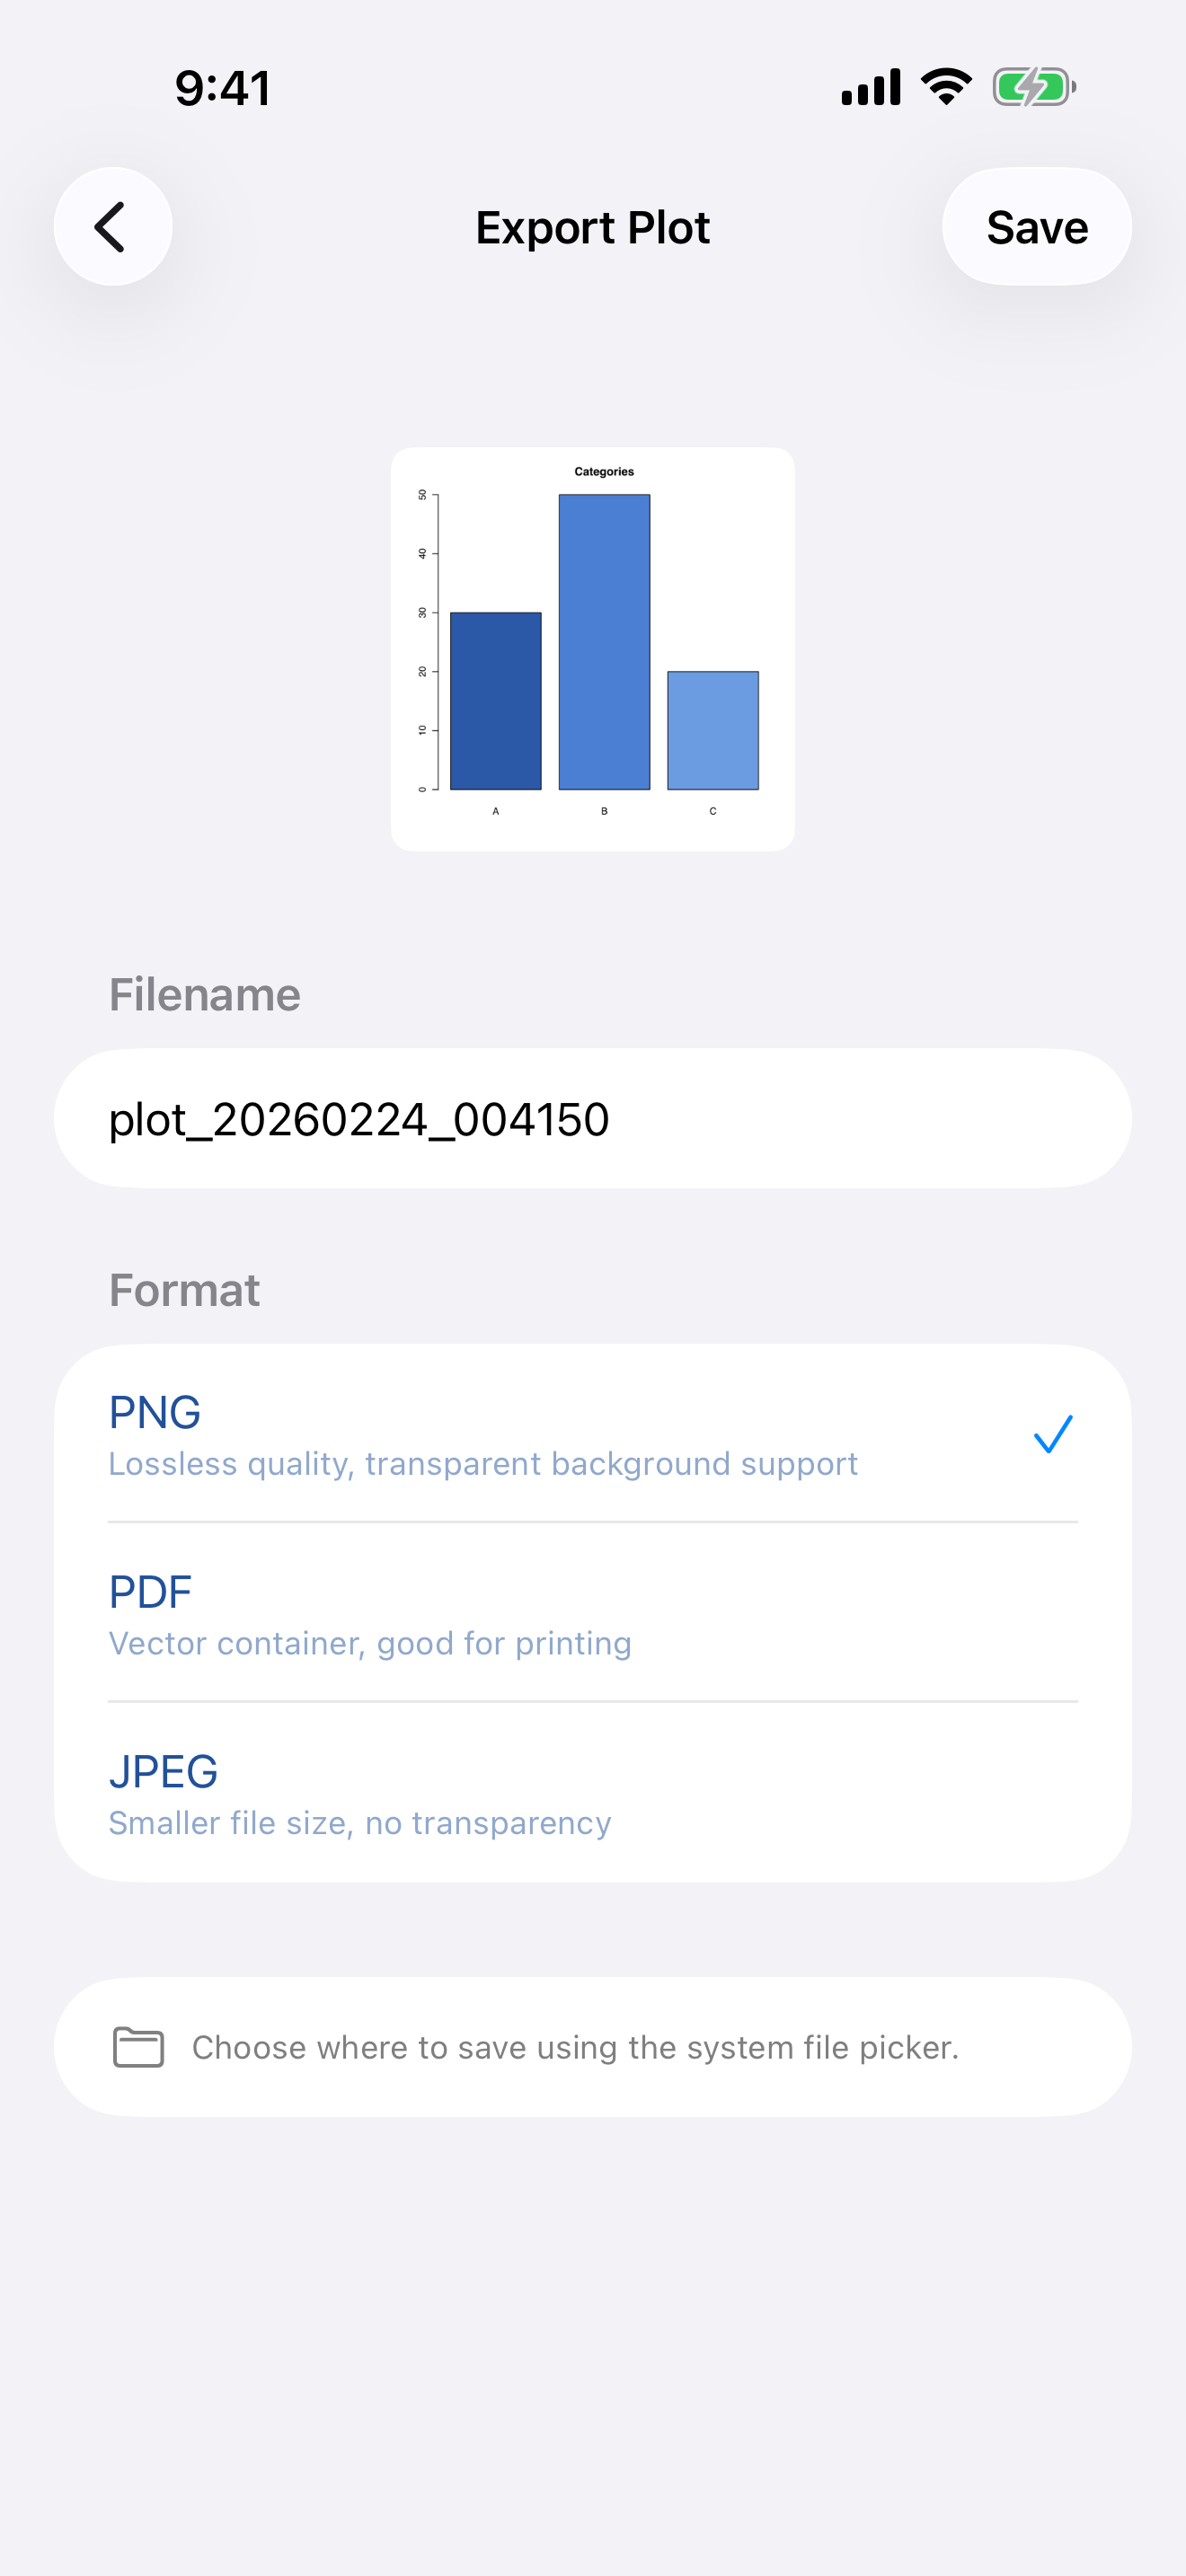
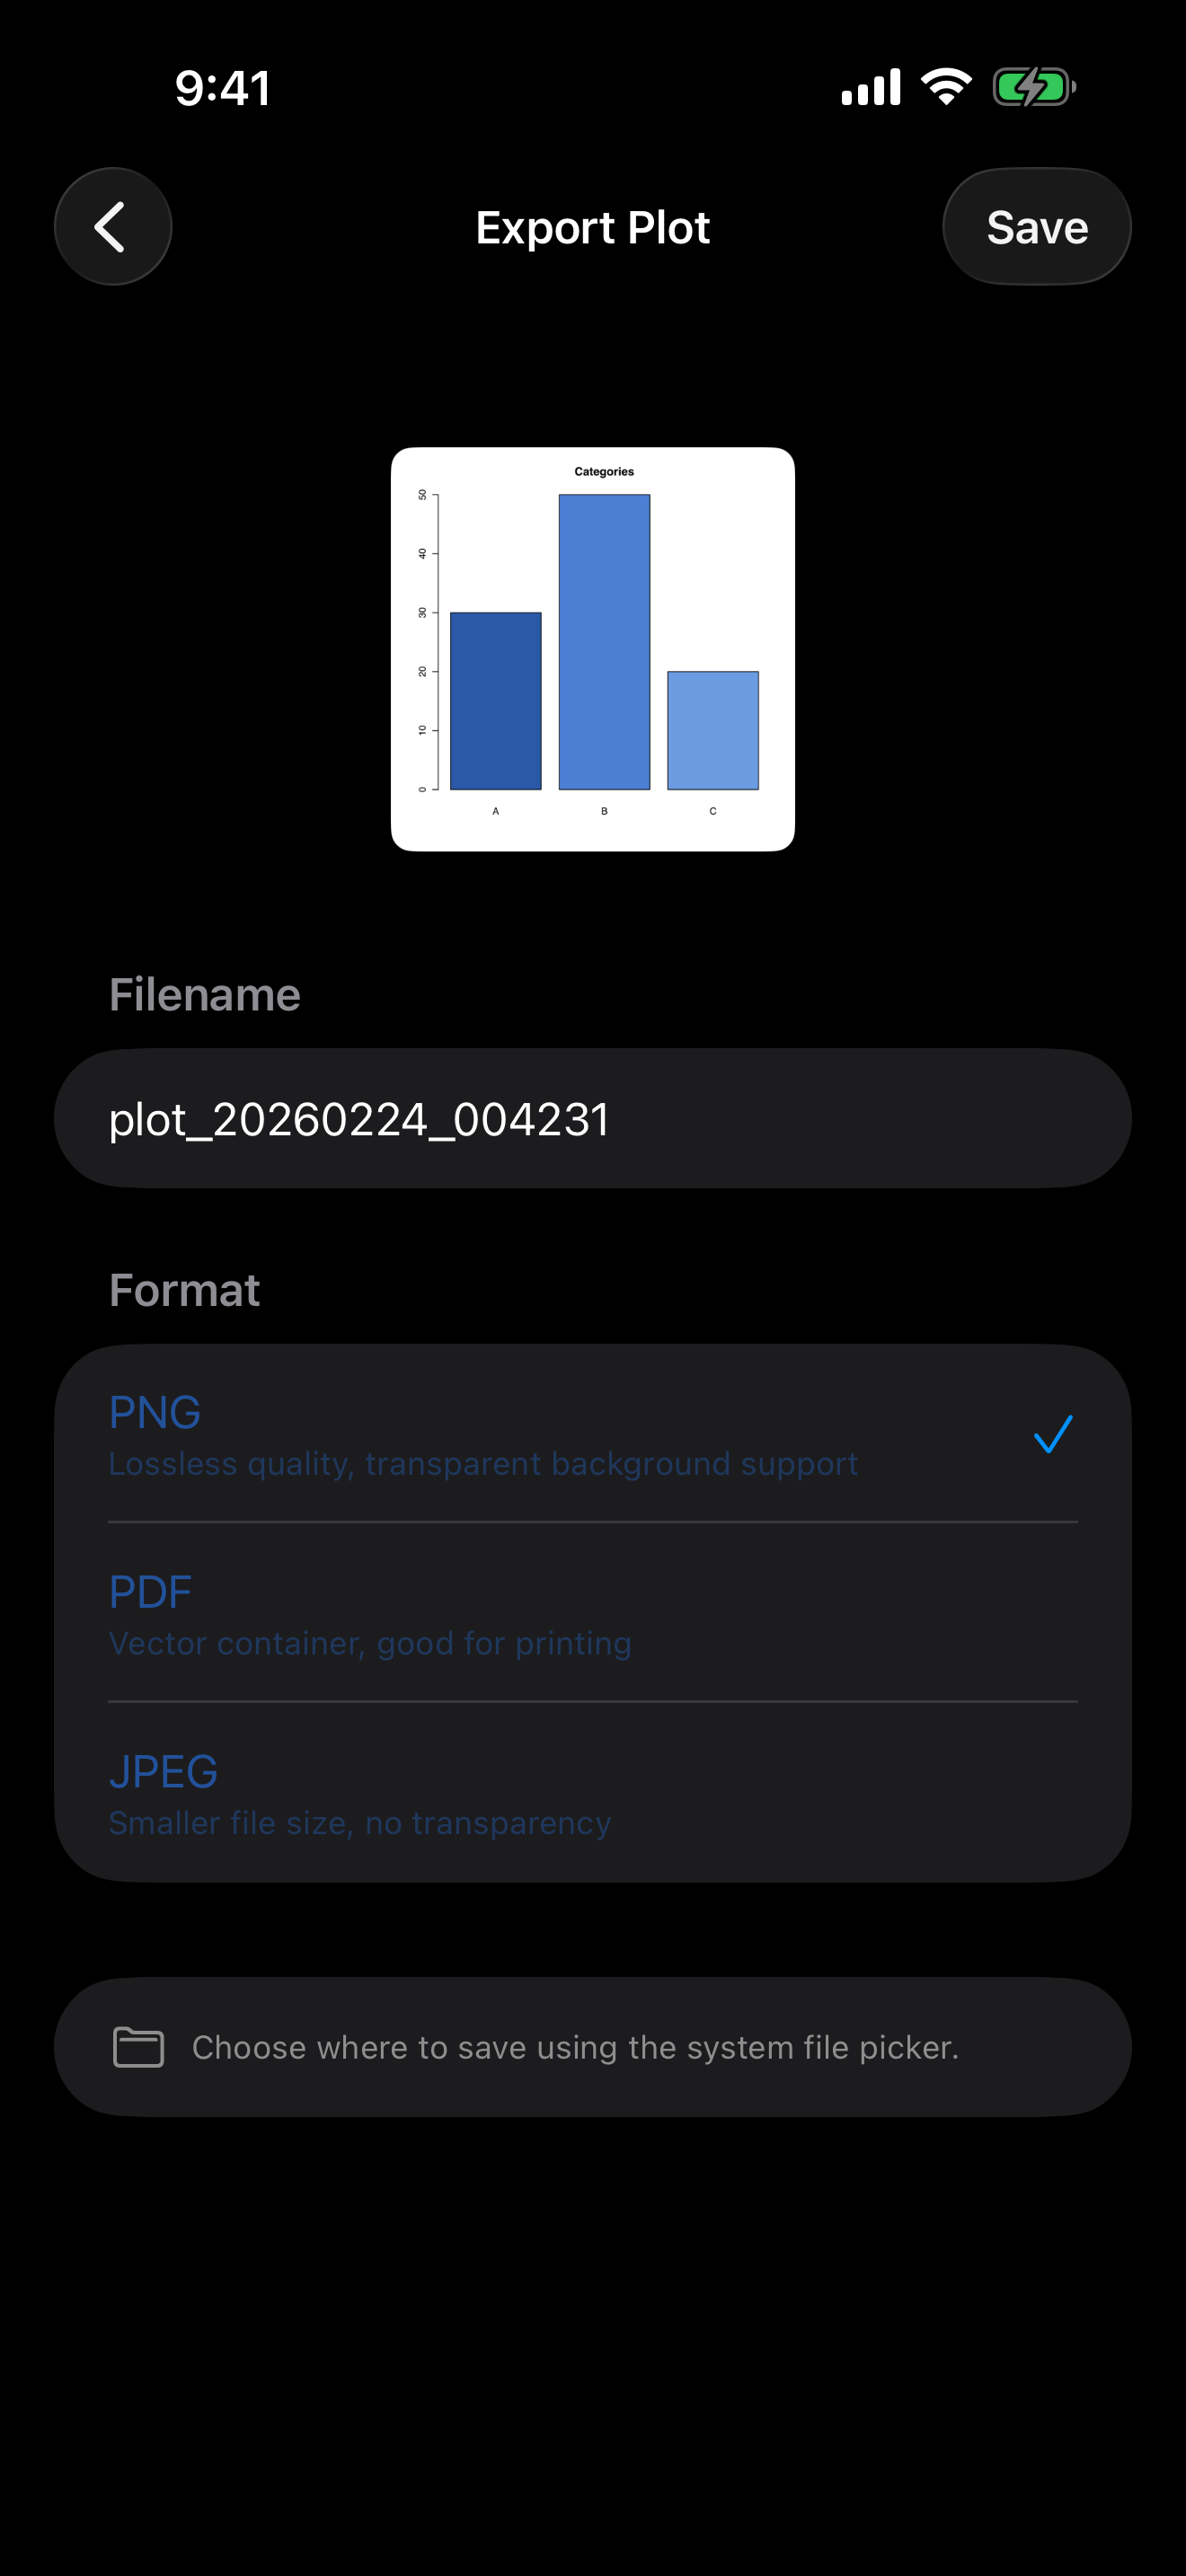
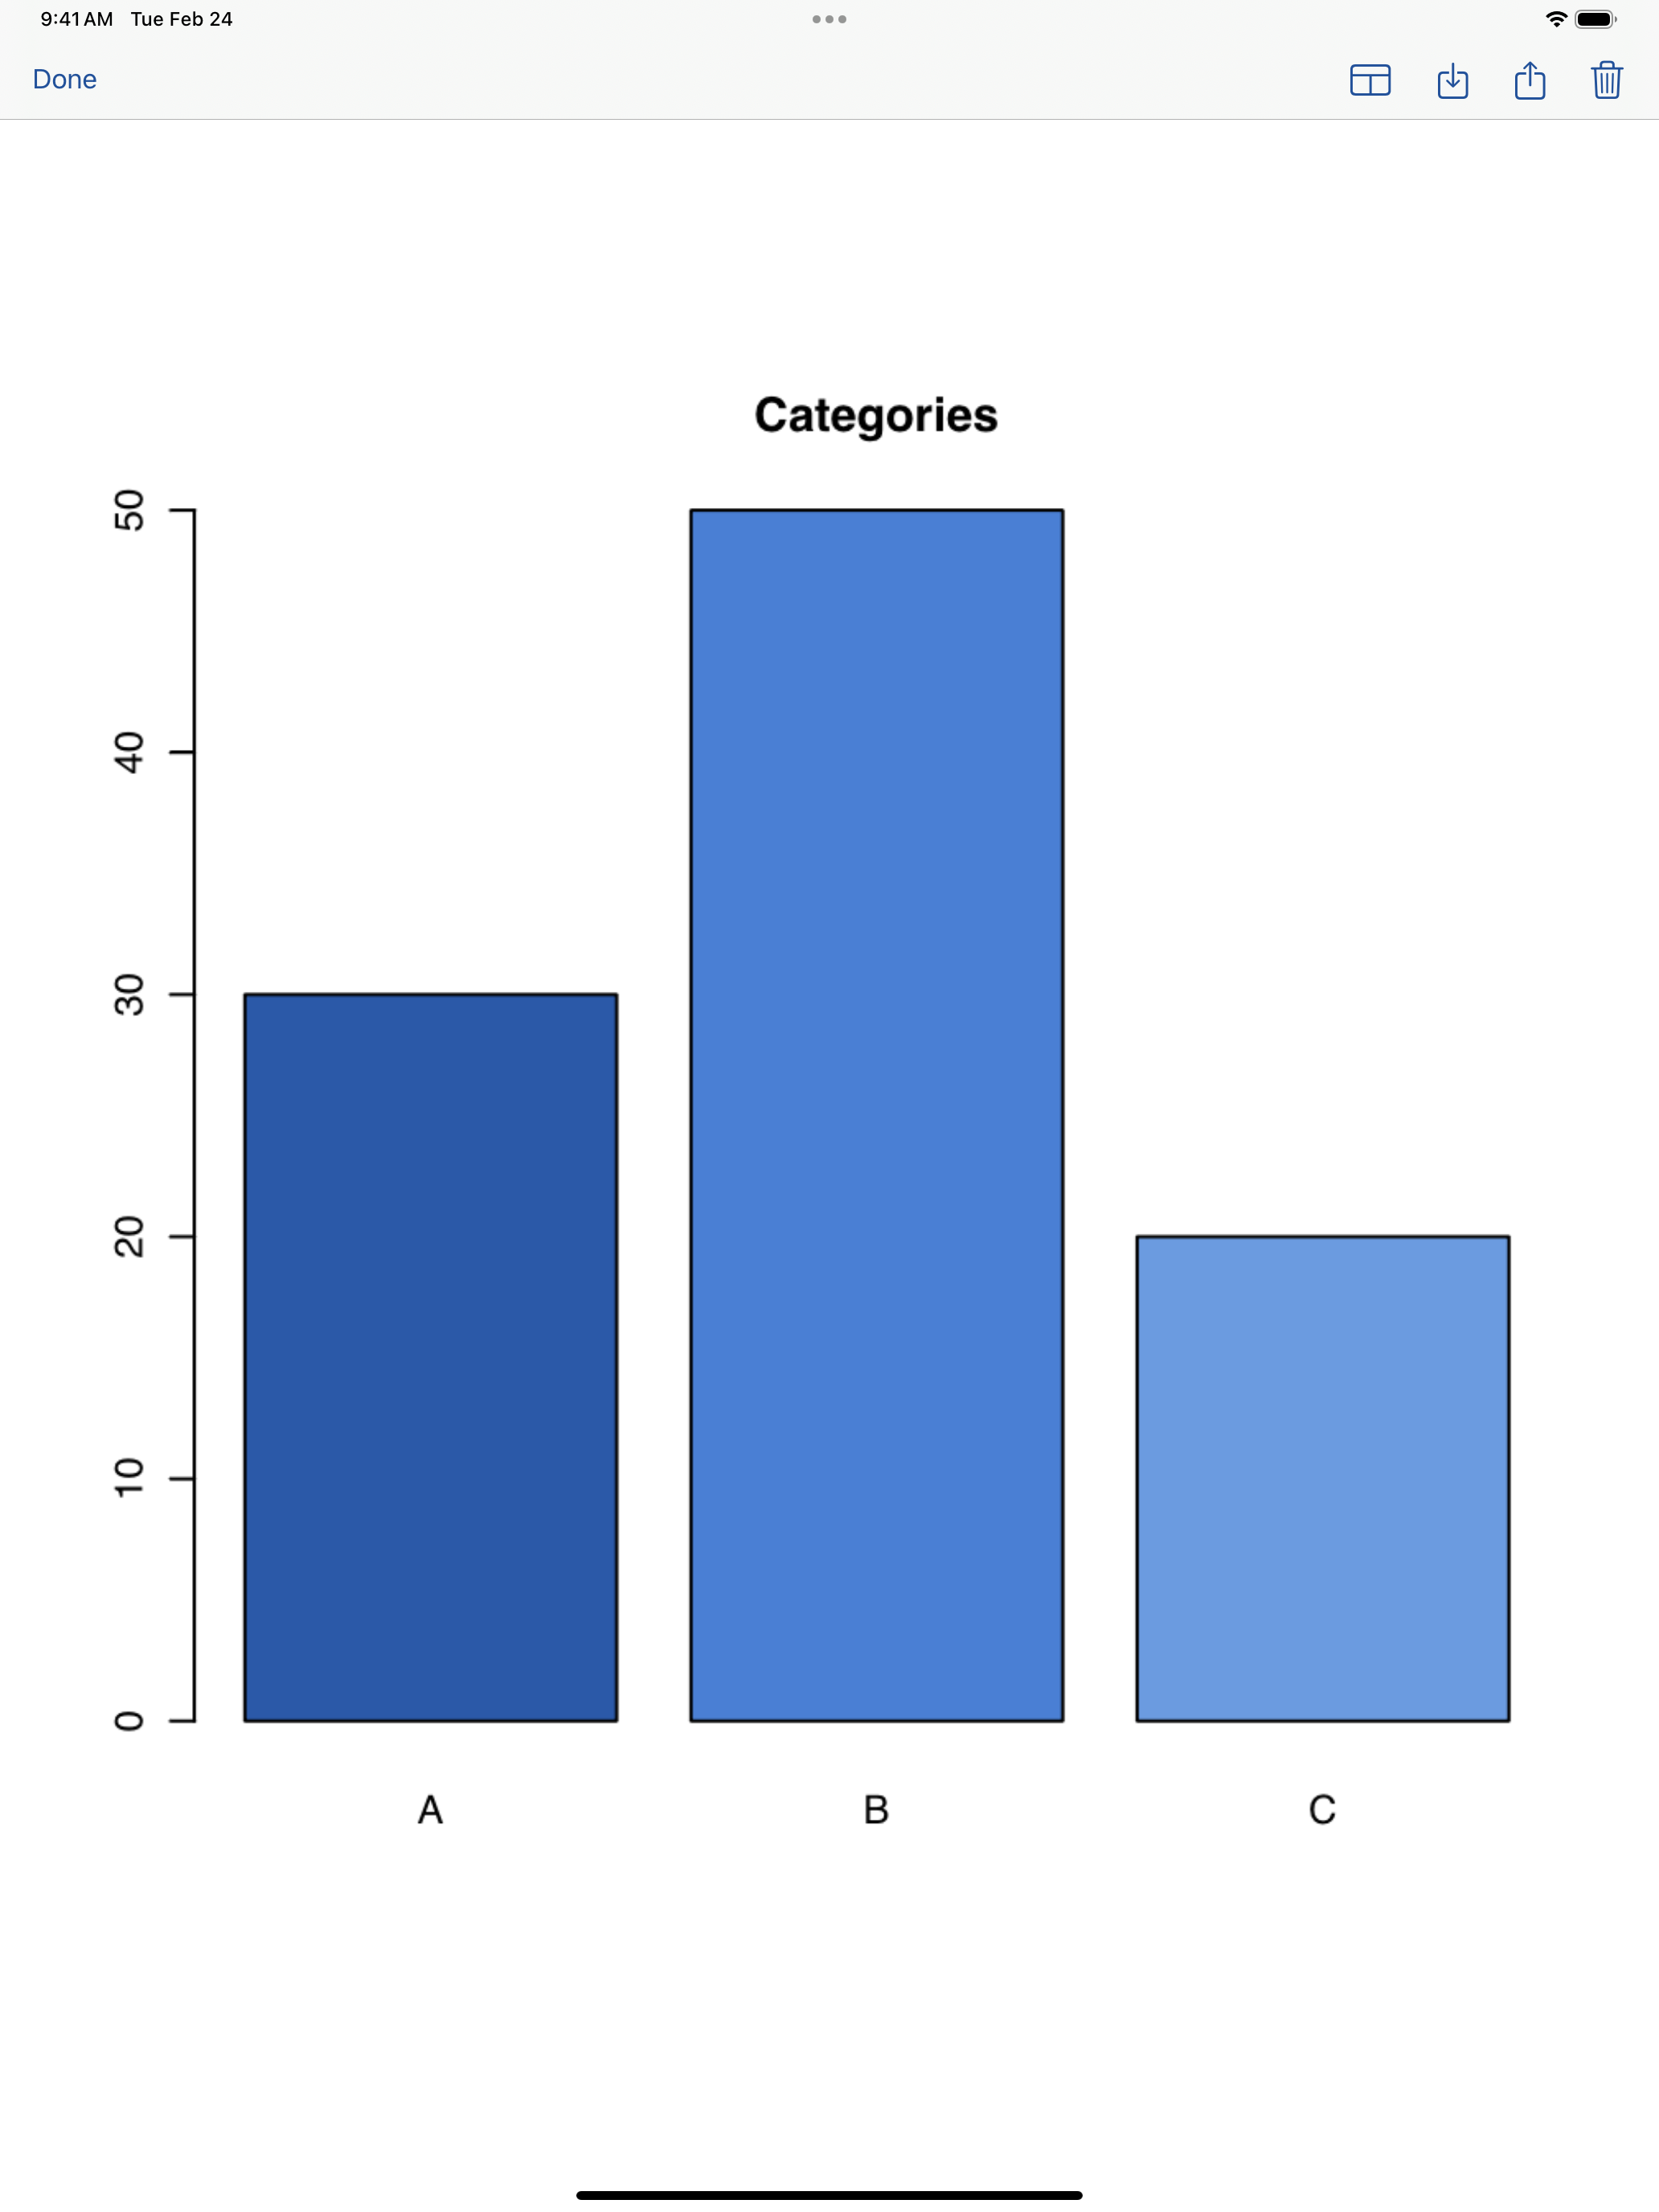
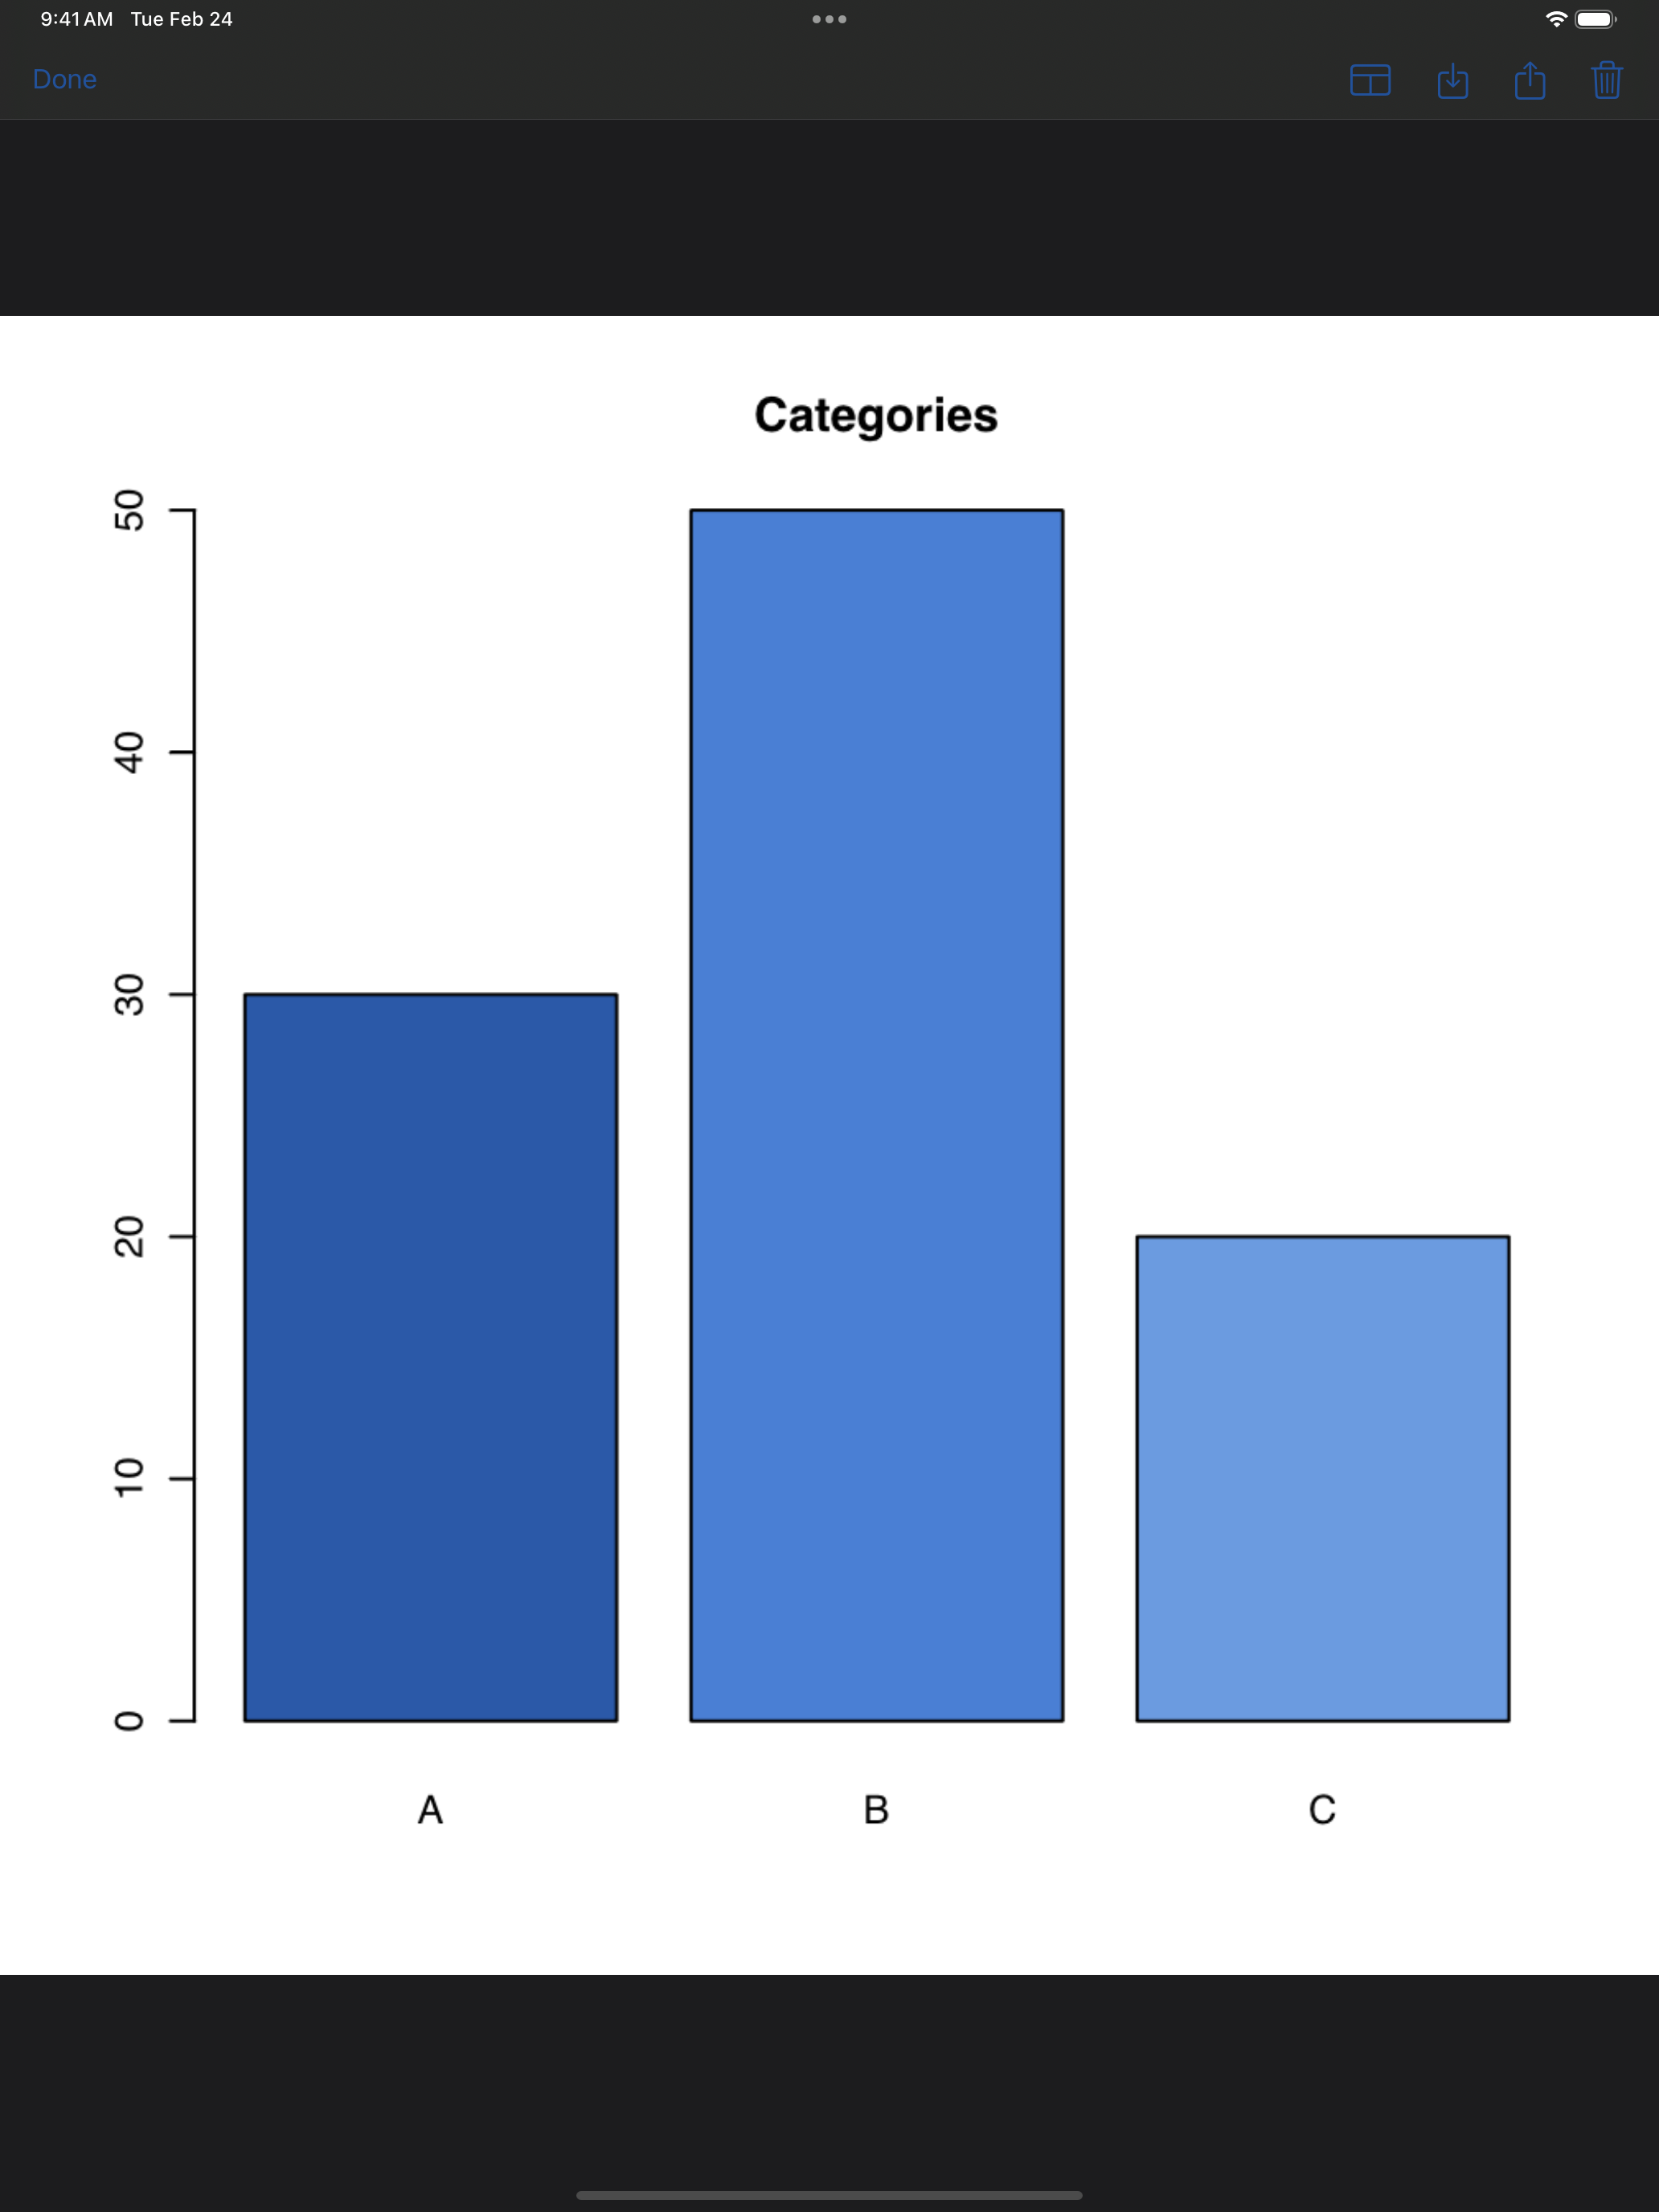
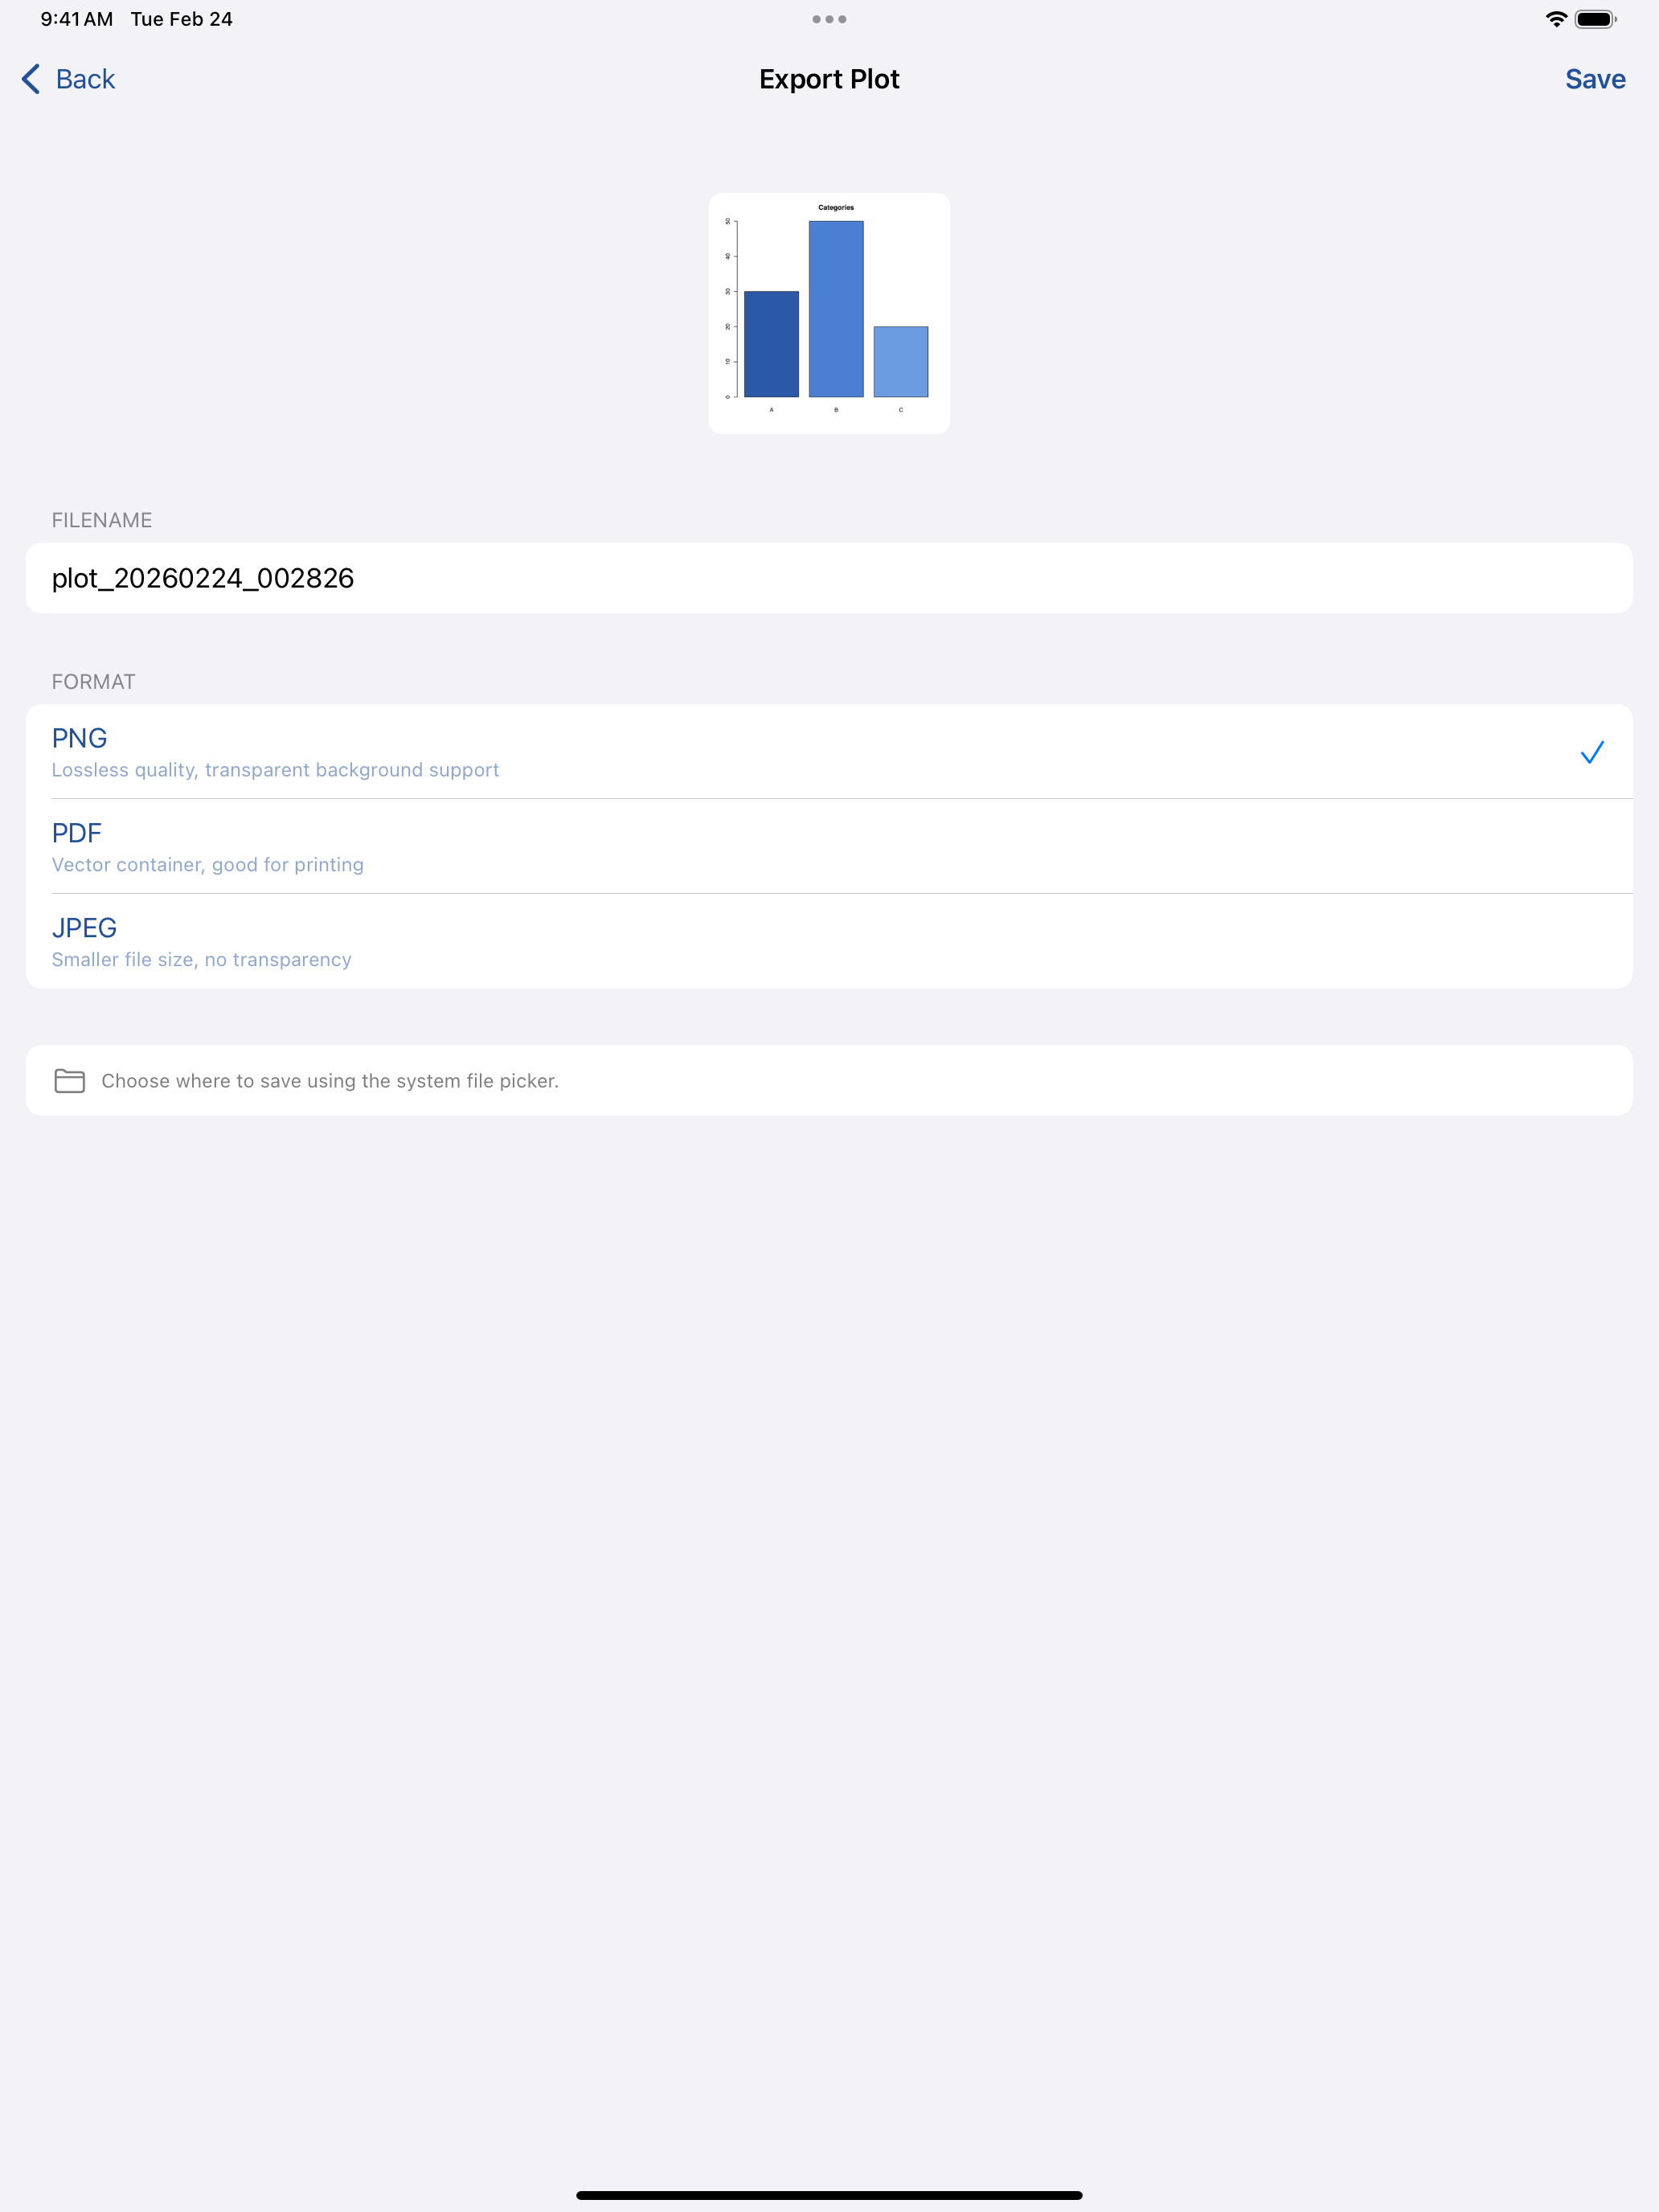
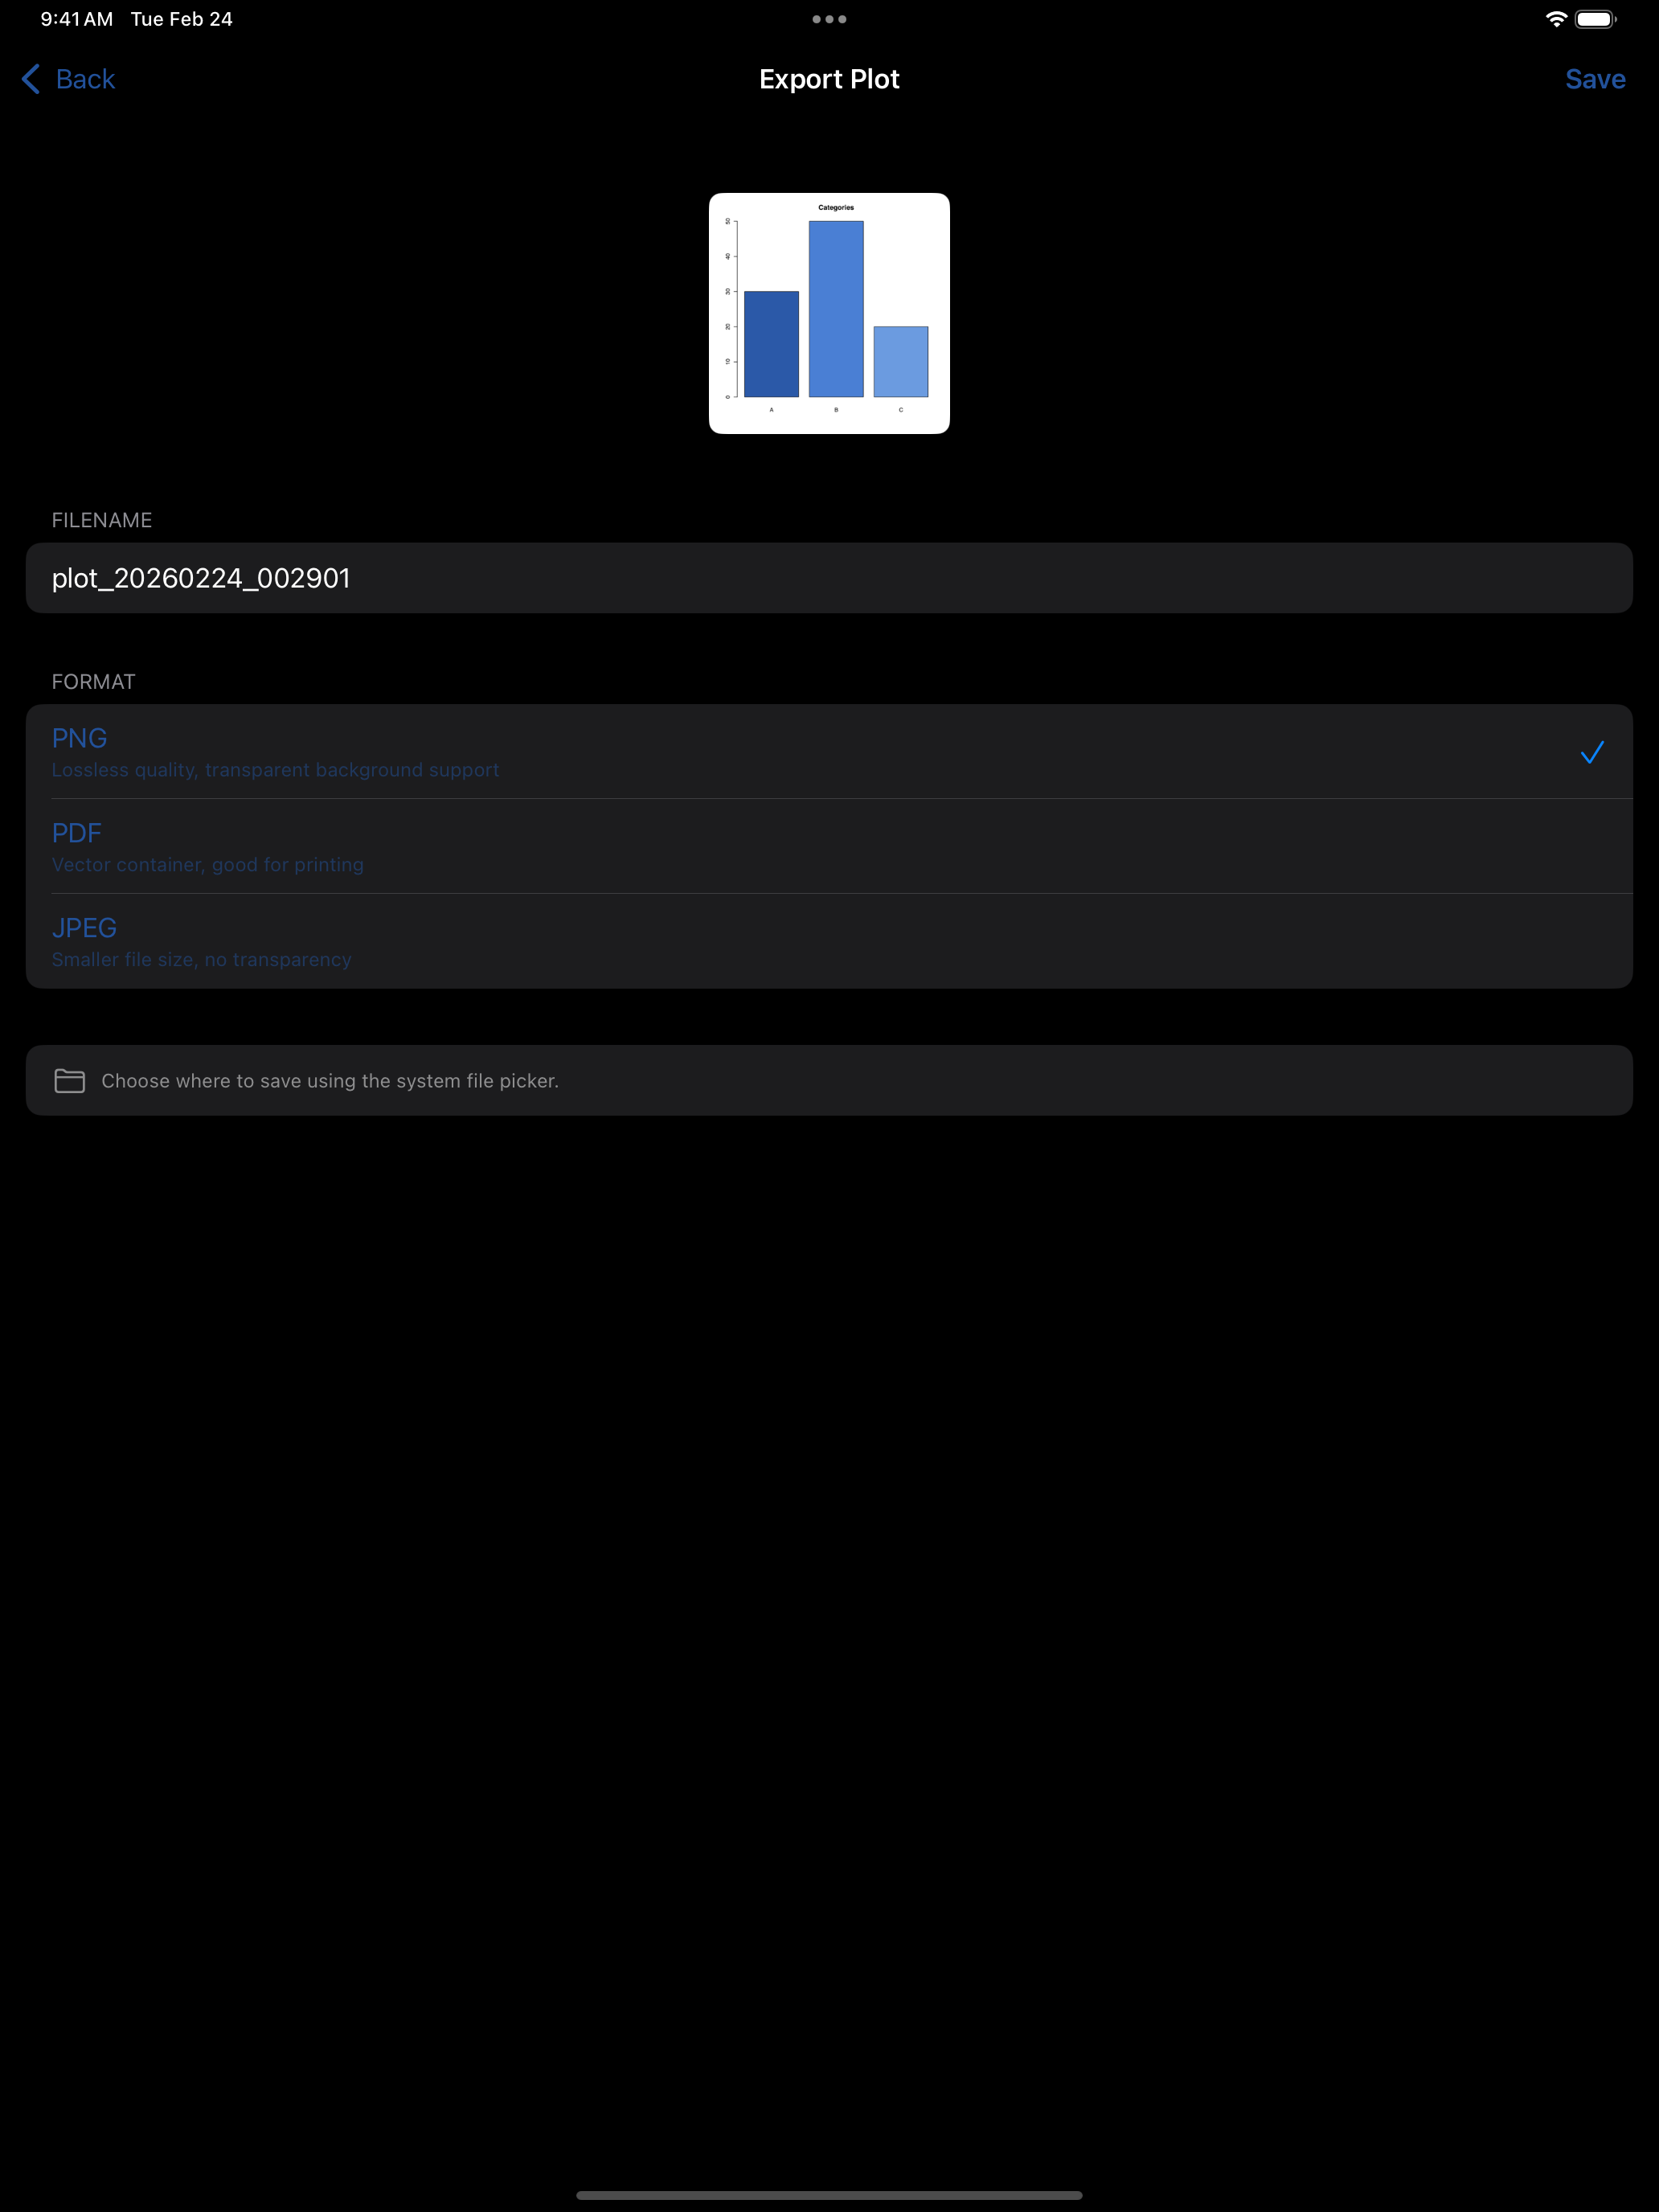
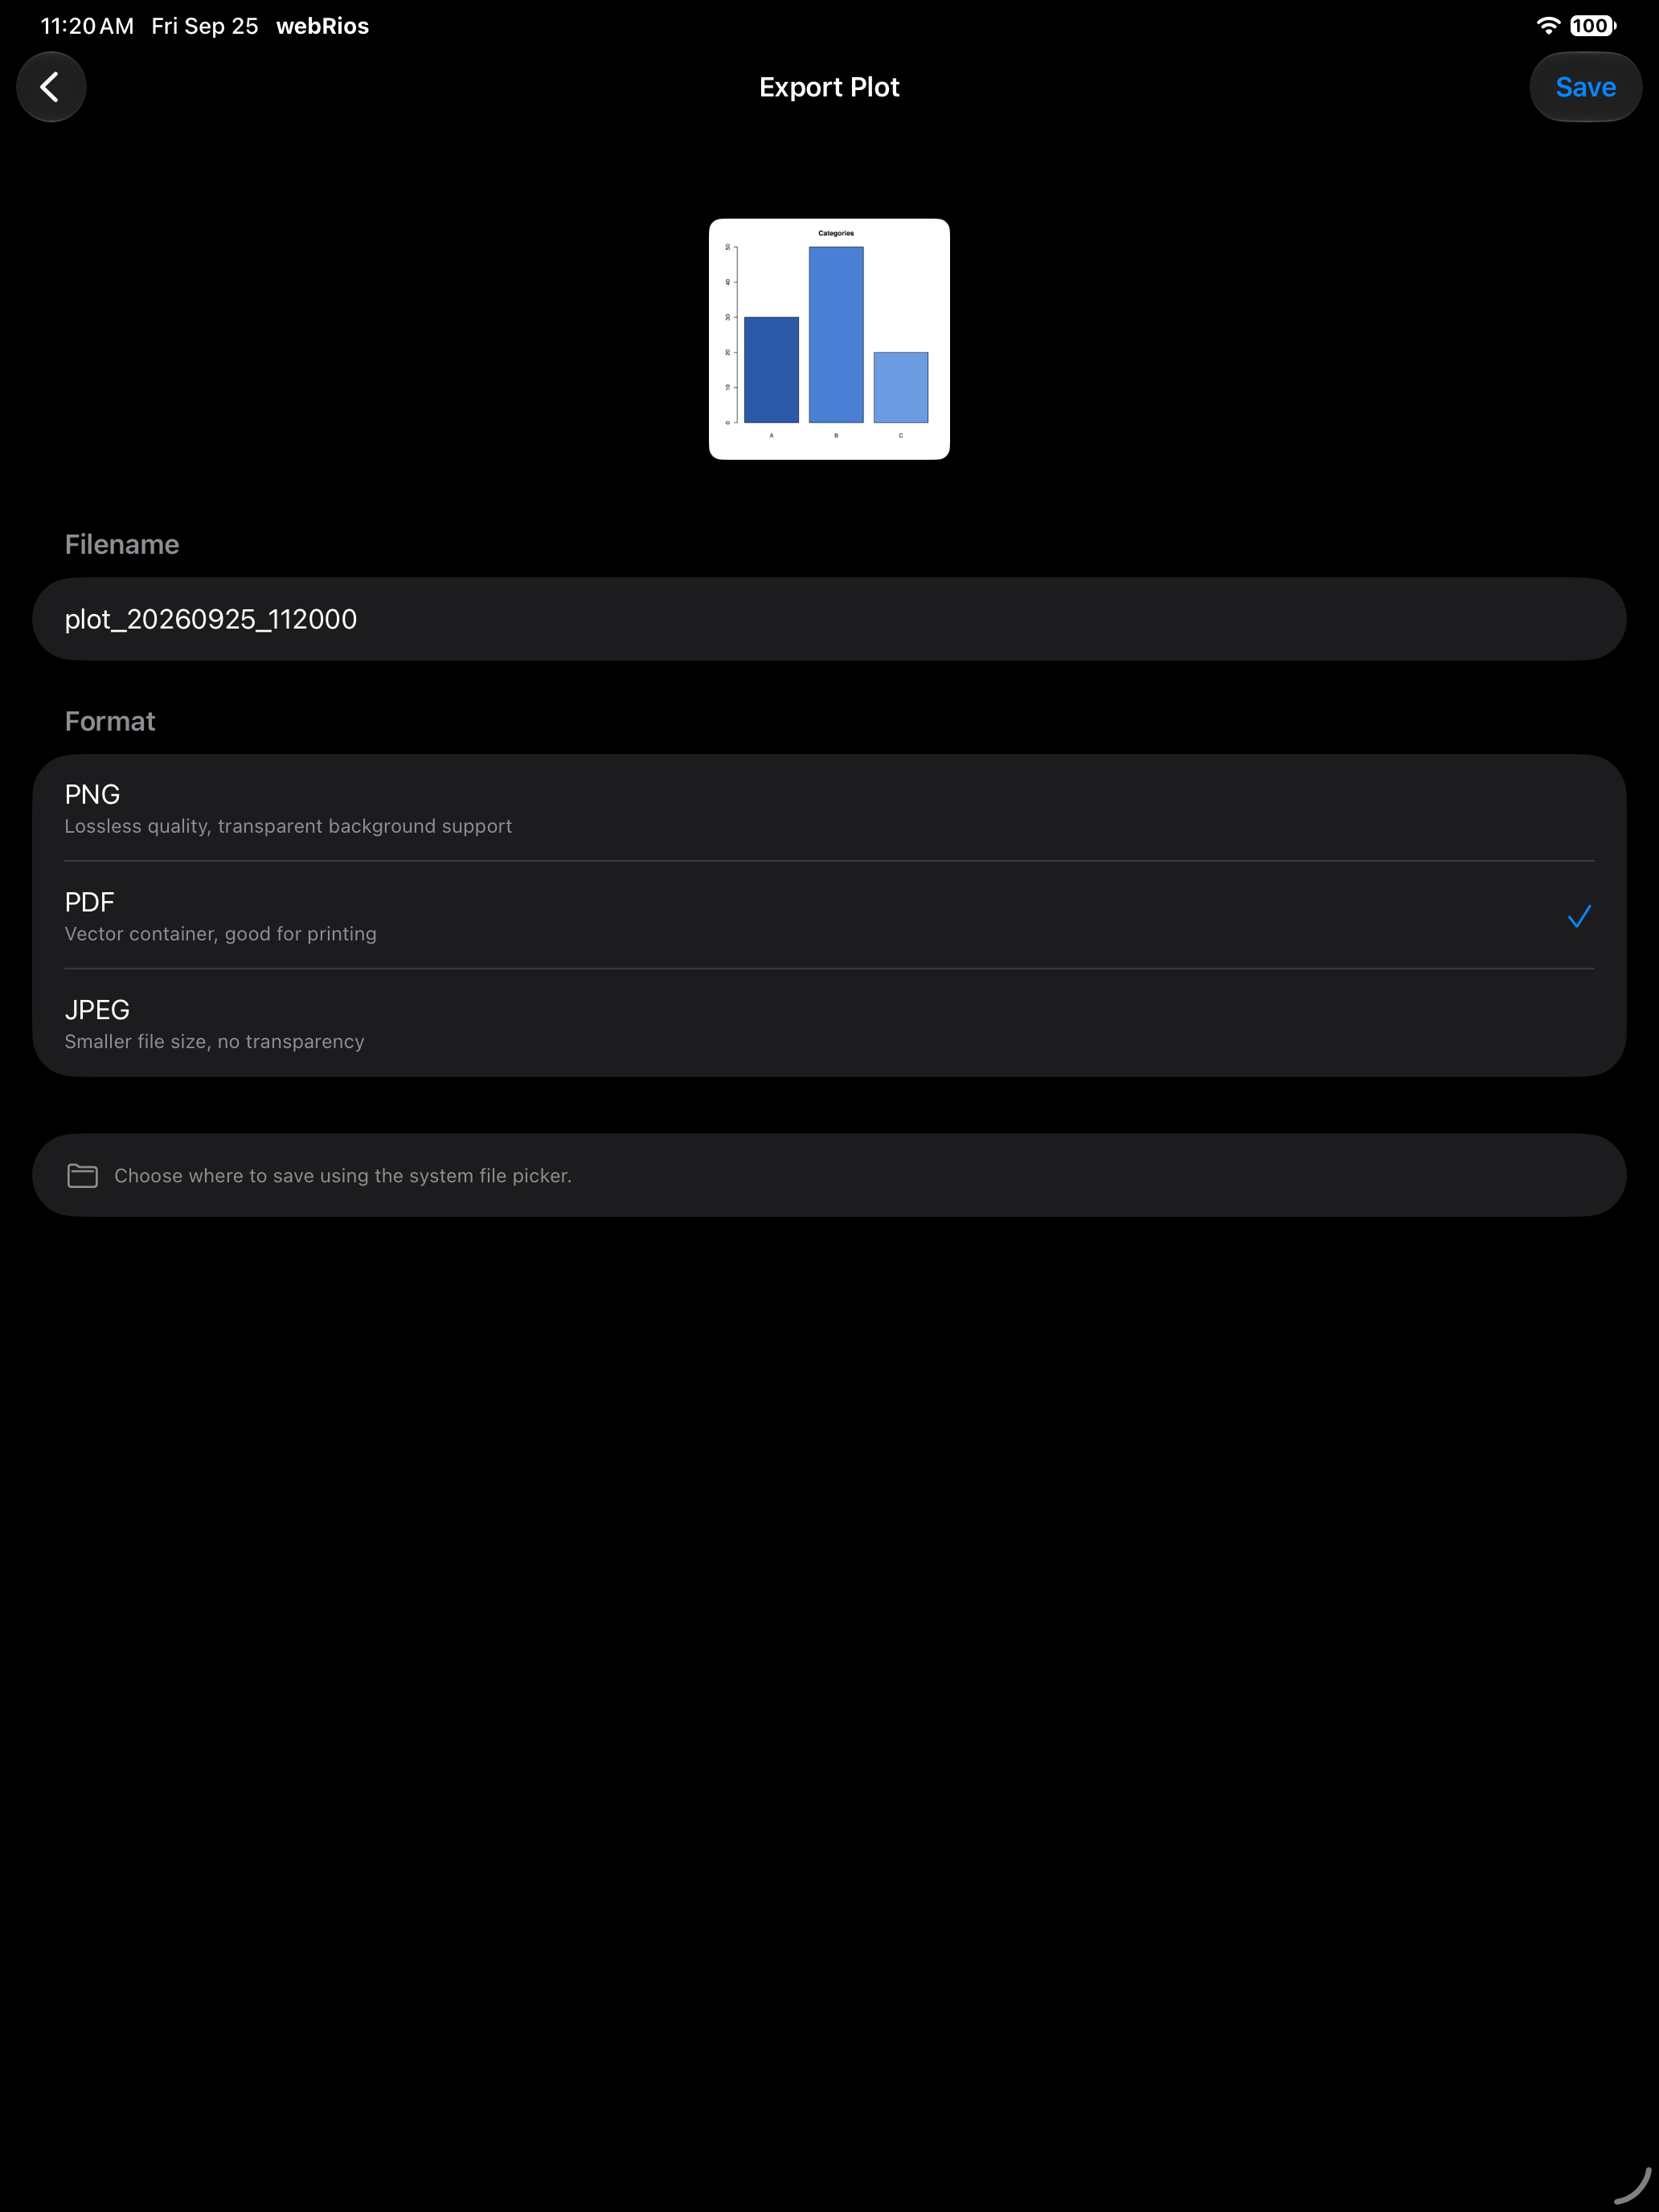
The left screenshot is the full-screen detail view. The right is the export menu, with its format and filename options.
A full-size plot sits as a card on the app’s background, matted in the Plot Background from Settings > Appearance. The choices are White (the default), System, Light Gray, Dark Gray, or Transparent for none. The plot itself stays white, so R’s black axes stay readable. The Compare view, Console plots and iPad plot windows use the same card.
Interactive Widgets
Packages built on htmlwidgets (plotly, leaflet, DT and others) produce interactive HTML, not an image. webRios keeps them apart. Tap the Interactive Plots card at the top of the gallery, or choose Plots > ⋯ > Interactive Plots, and Done to close.
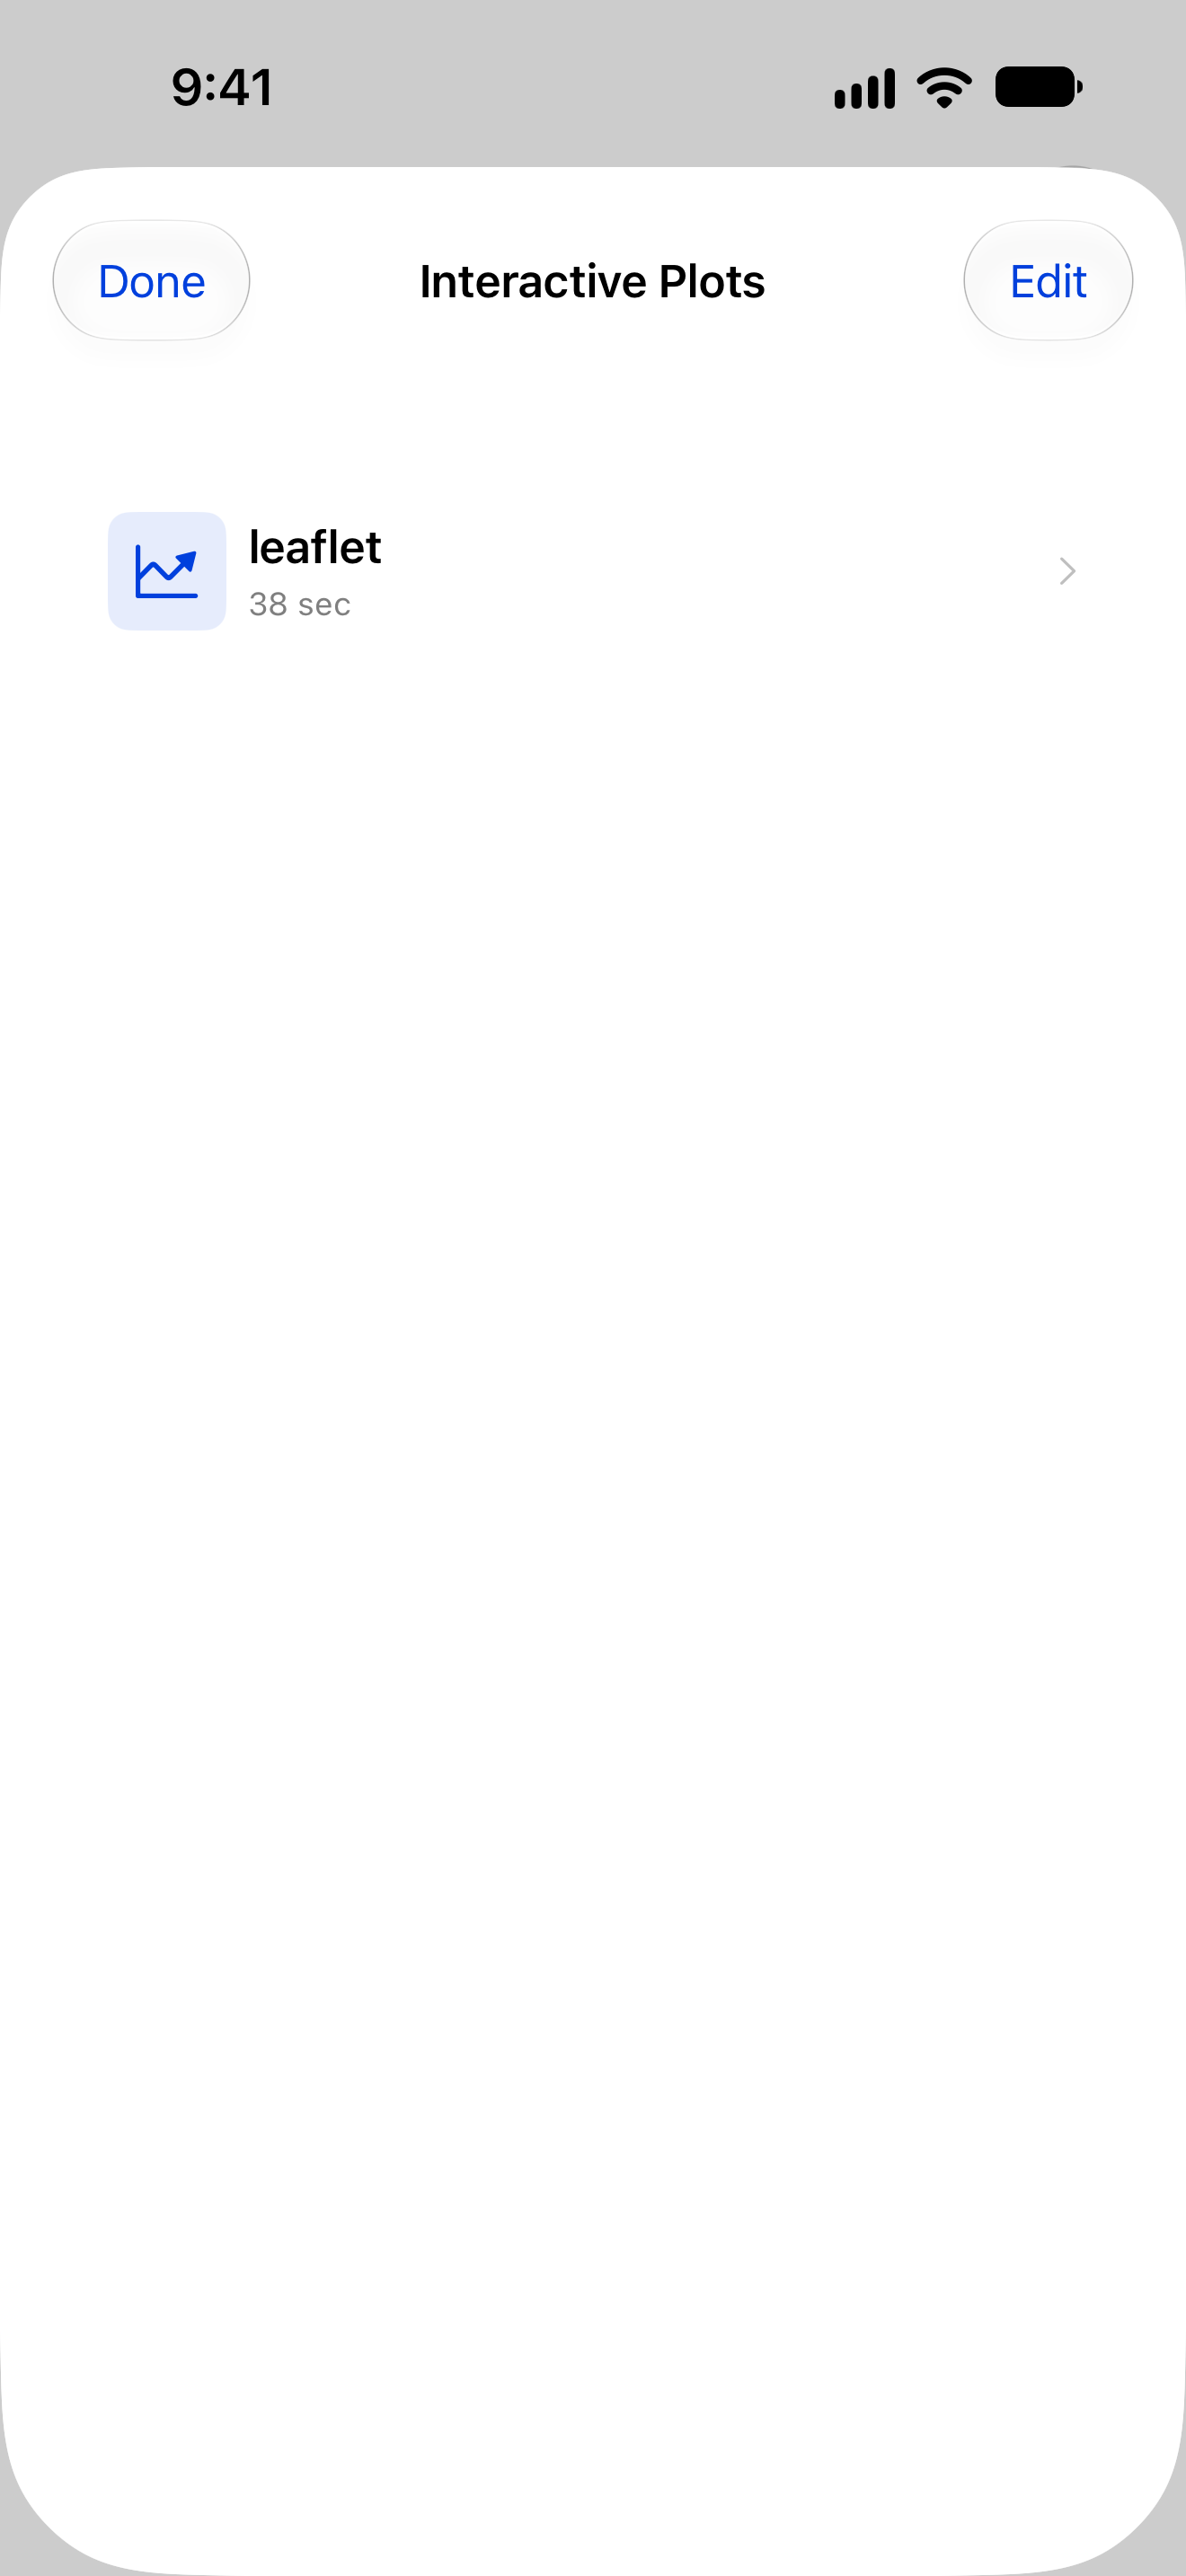
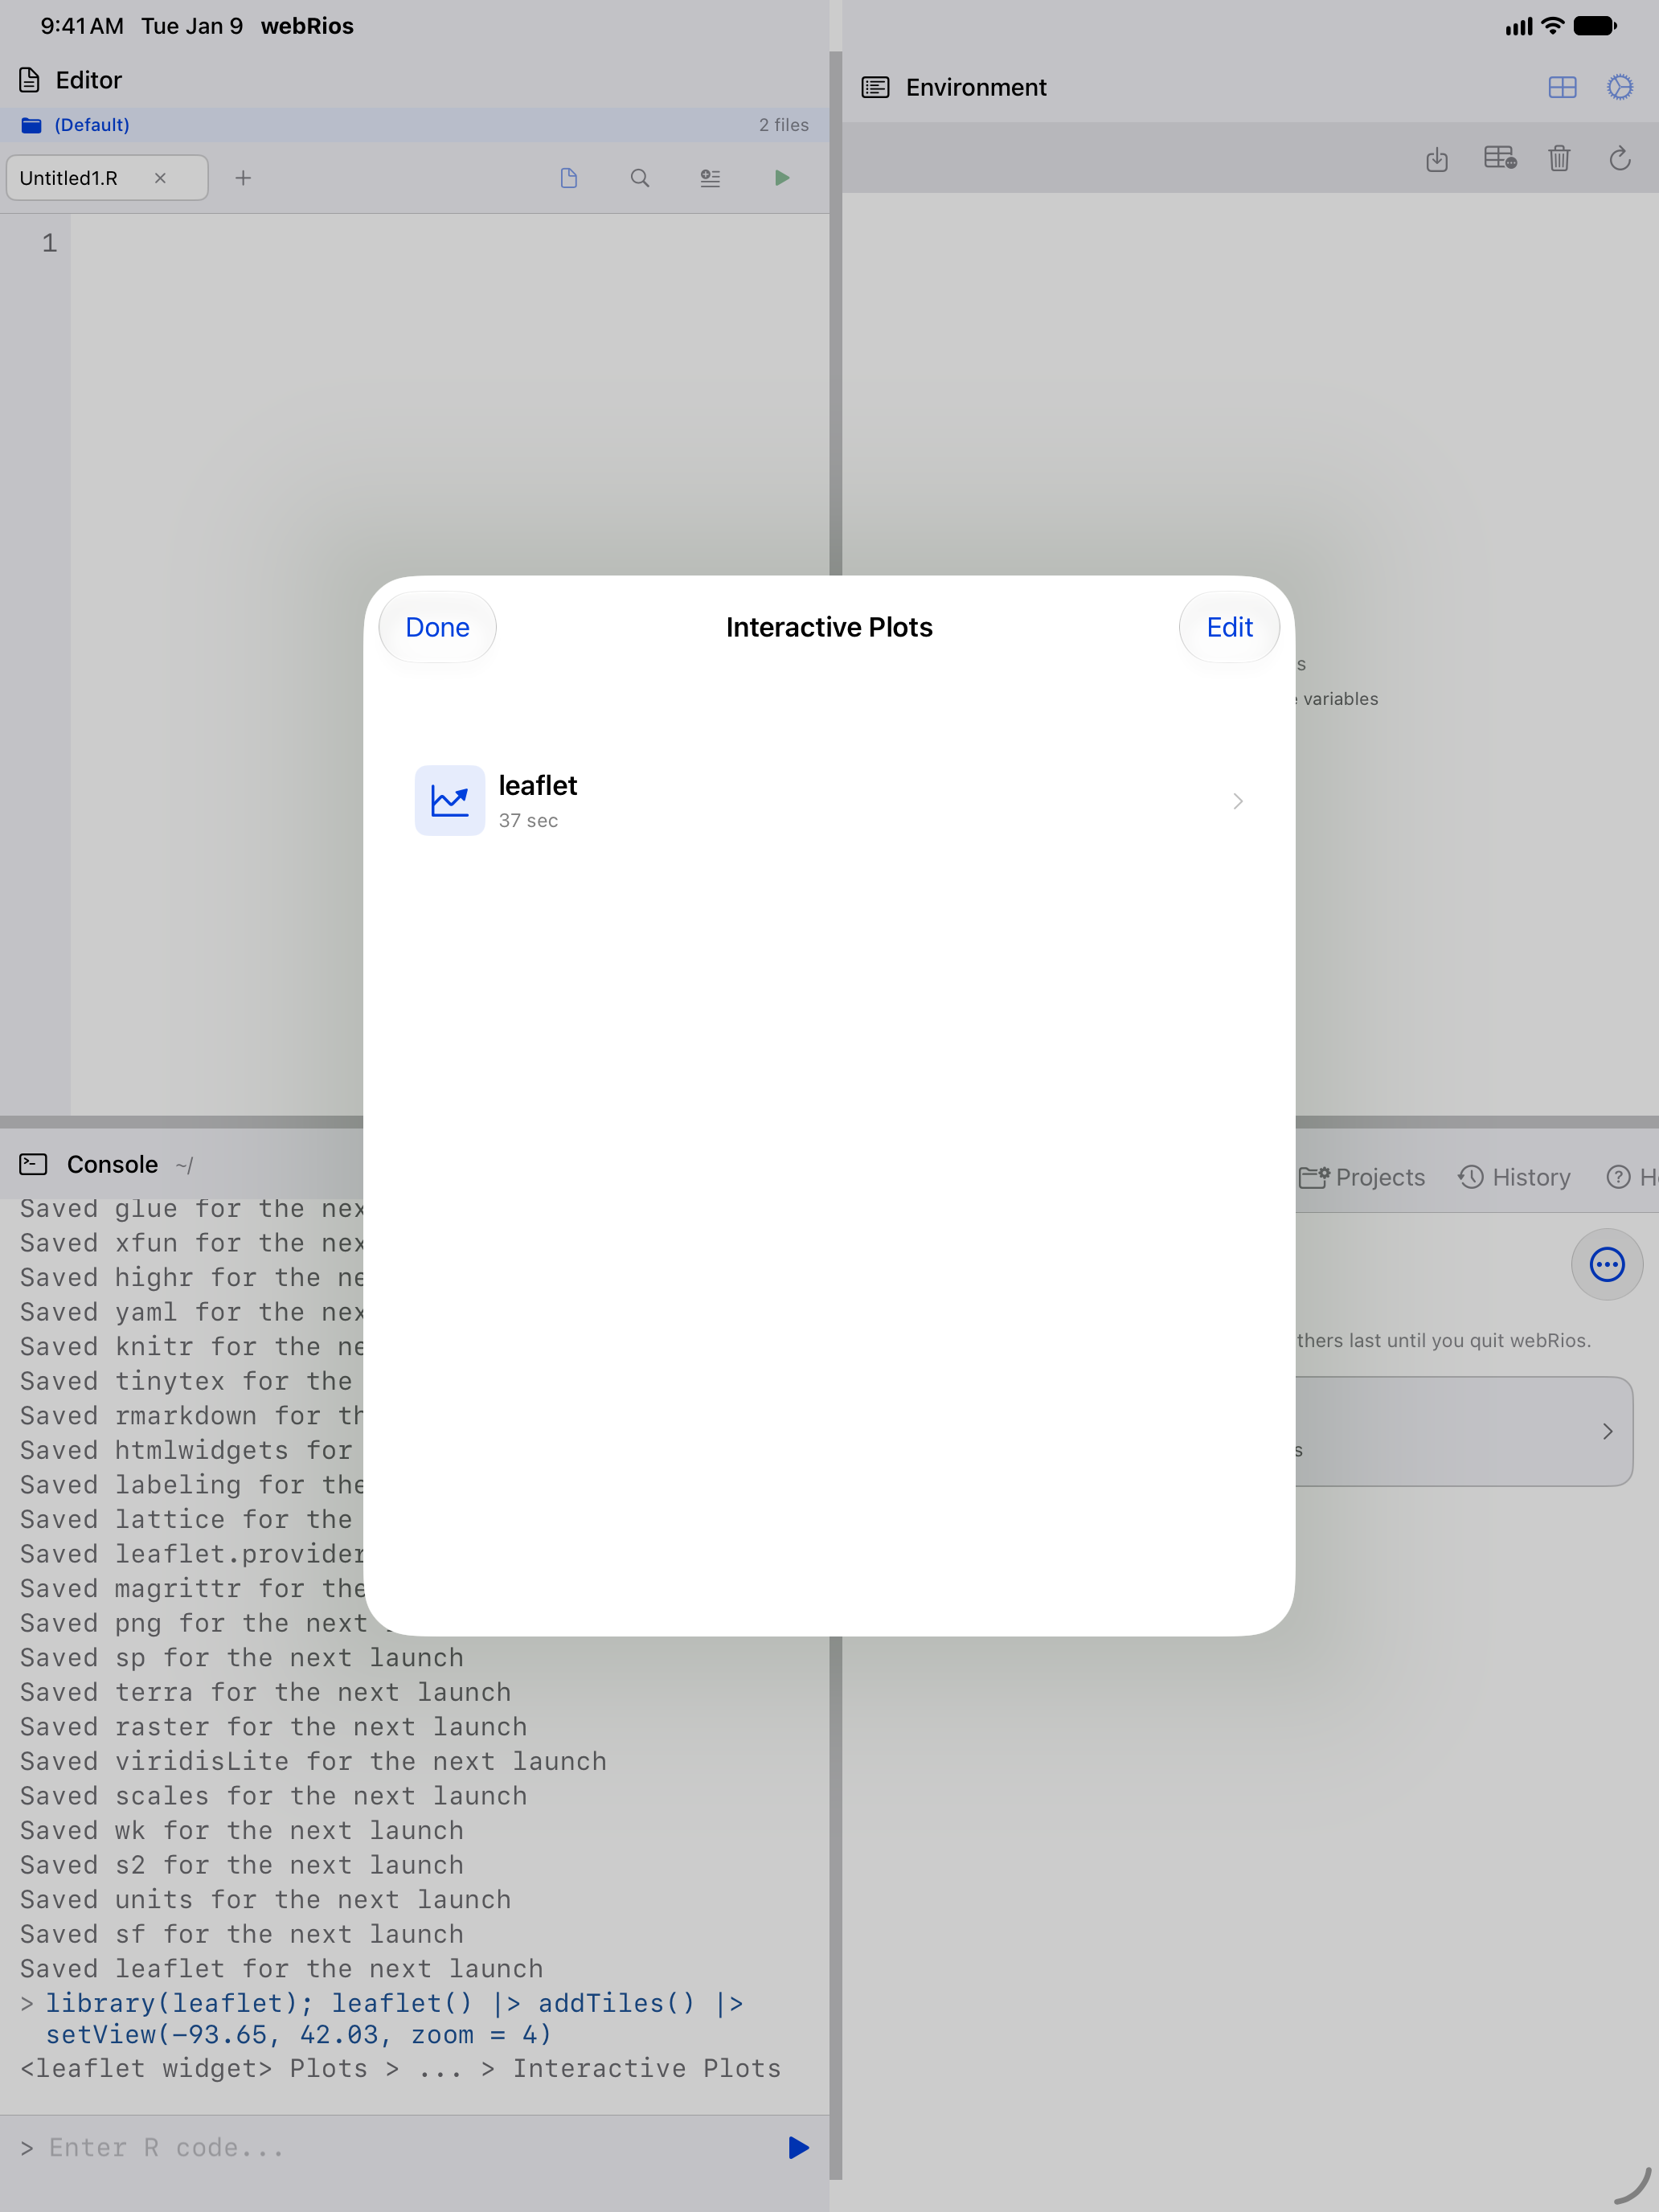
Each opens as a live widget. A leaflet map pans and zooms, a plotly chart shows tooltips, and a DT::datatable() table sorts, searches and pages.
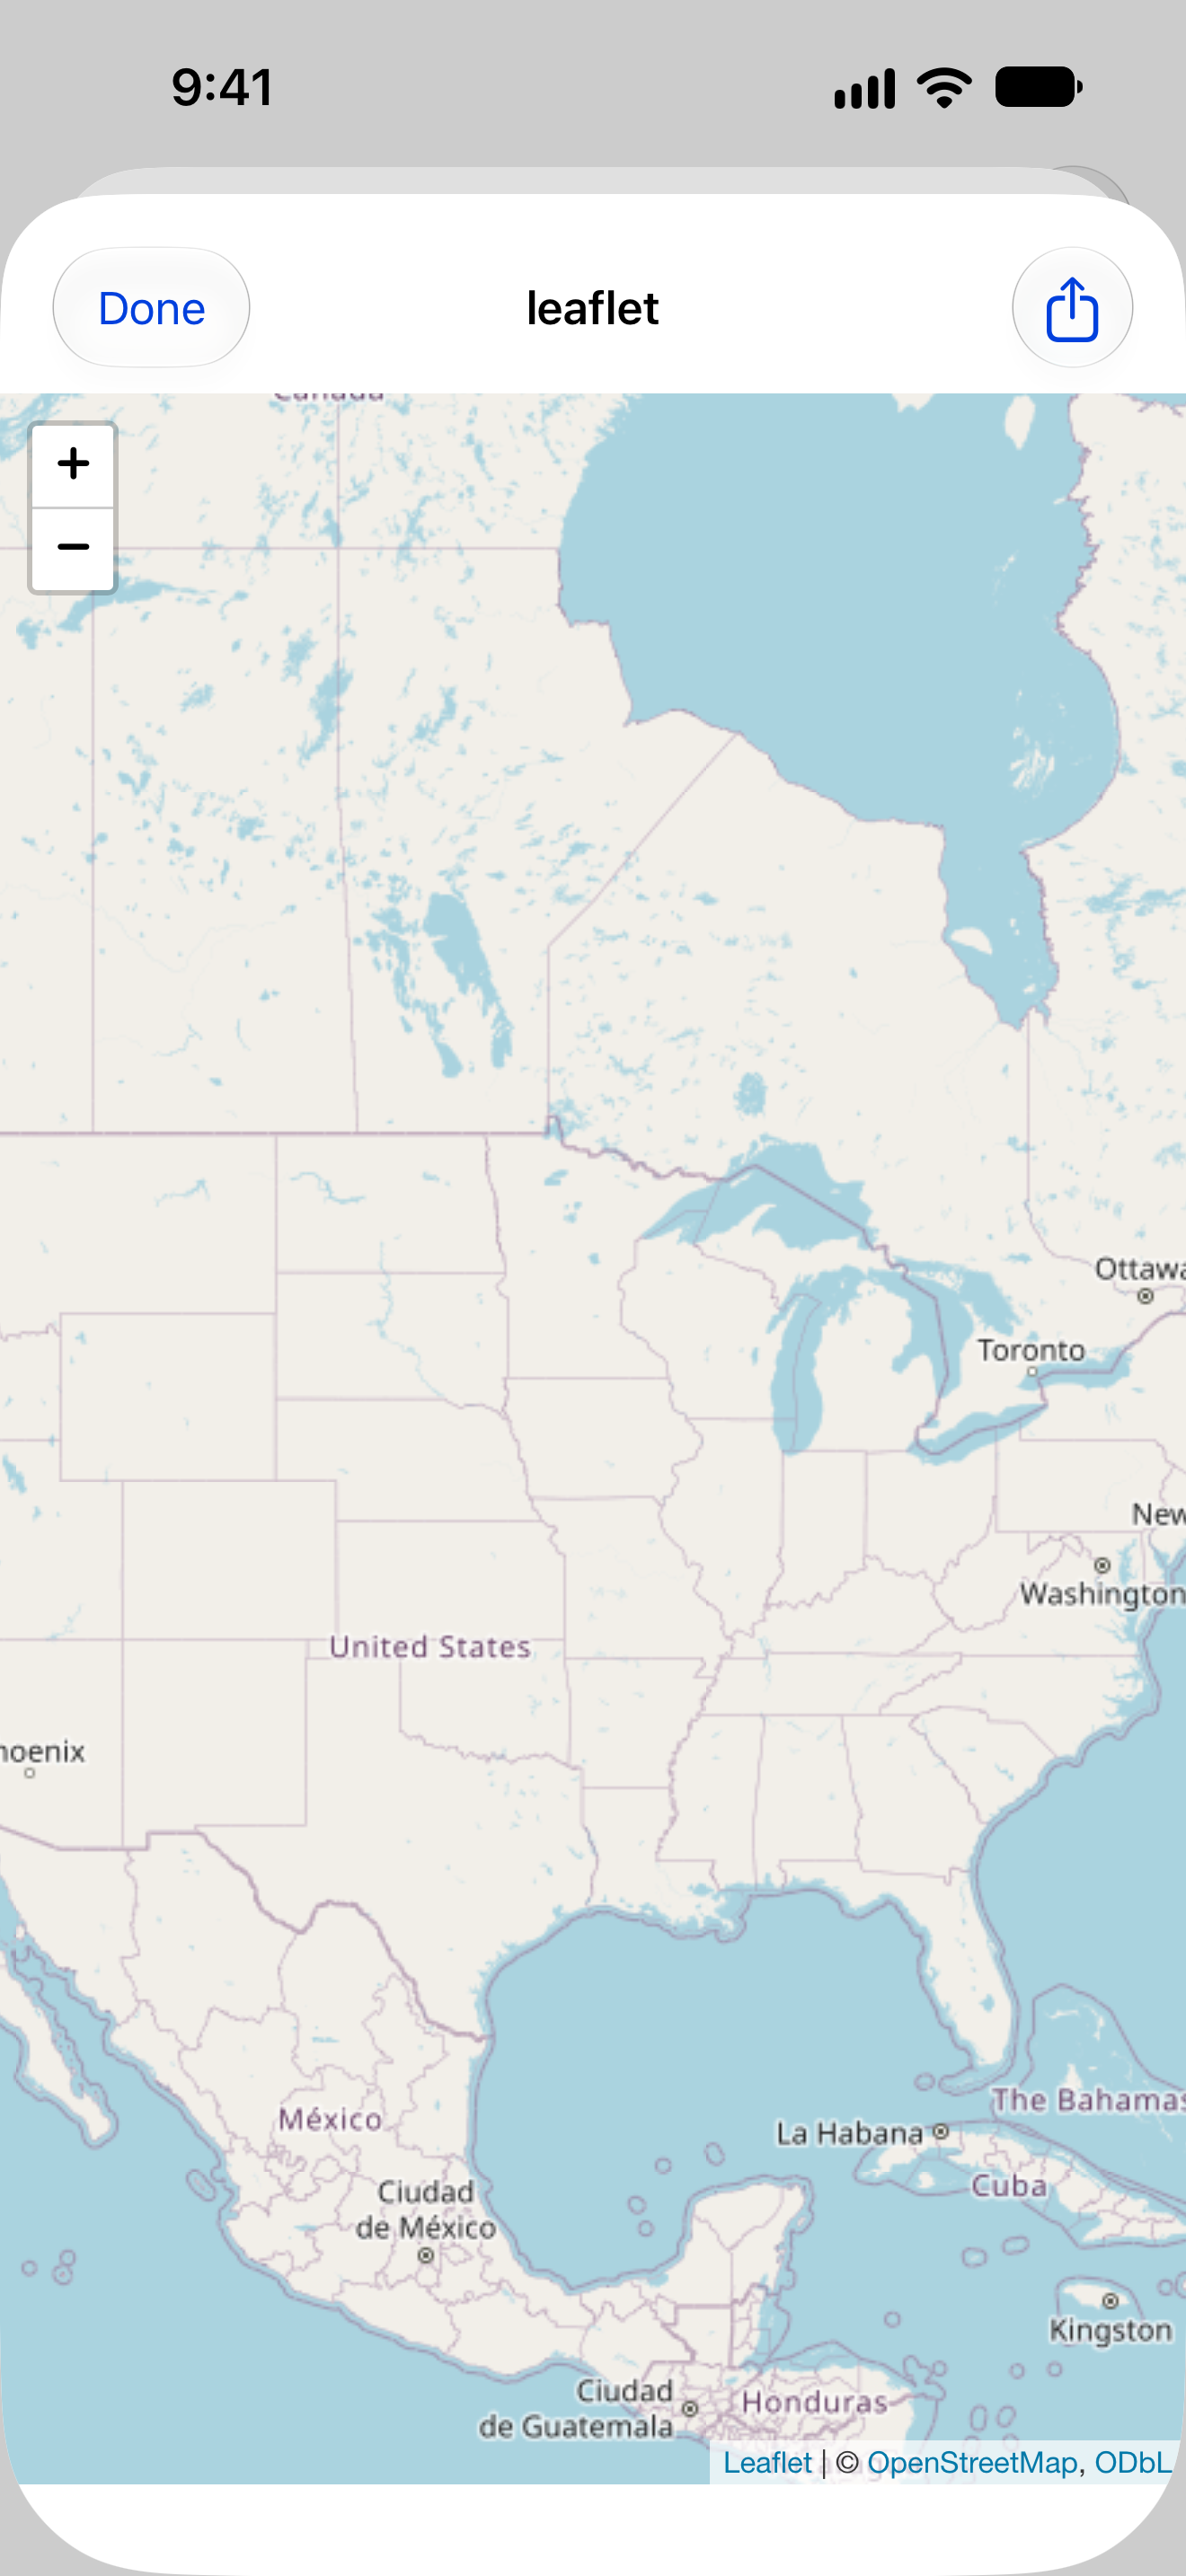
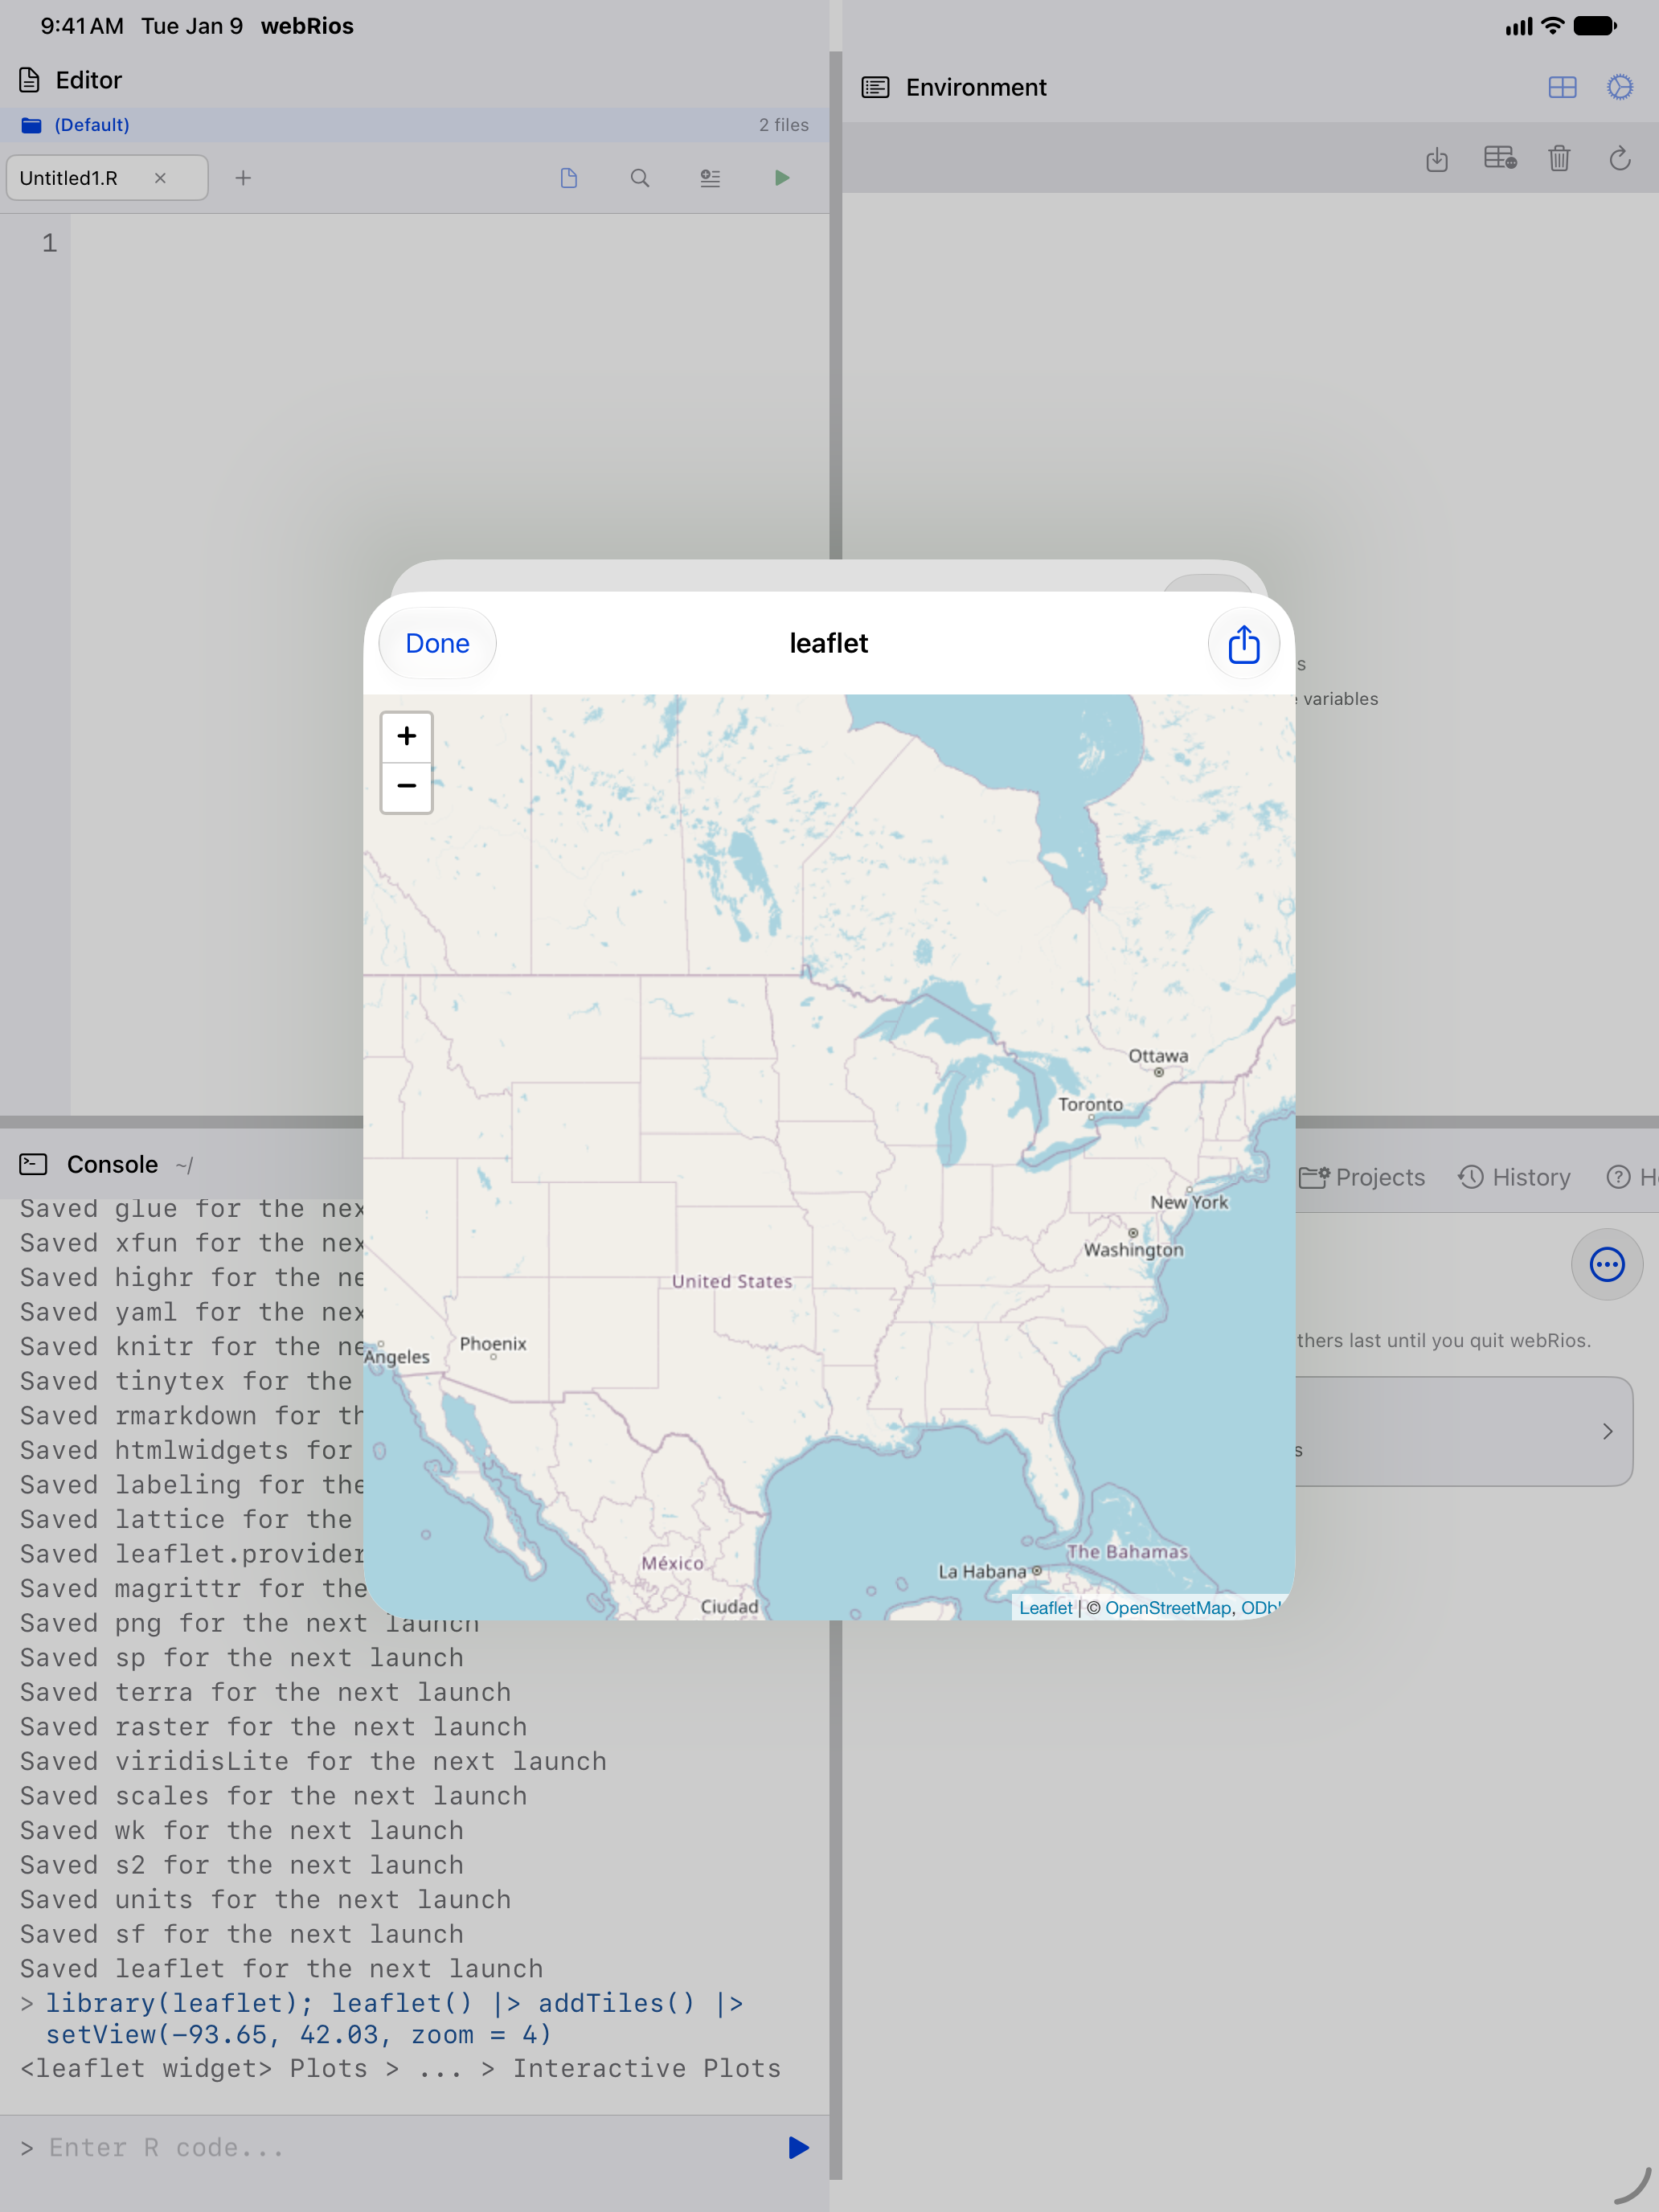
A widget that fills its page, such as a plotly chart, a leaflet map or a DT table with fillContainer = TRUE, runs edge to edge. Others, such as an ordinary DT table, sit at their own height with a margin. Text is the system font, dark on white, unless the widget sets its own. The page stays white in dark mode, since widgets are drawn to be read on white. This is datatable(mtcars[, 1:4]).
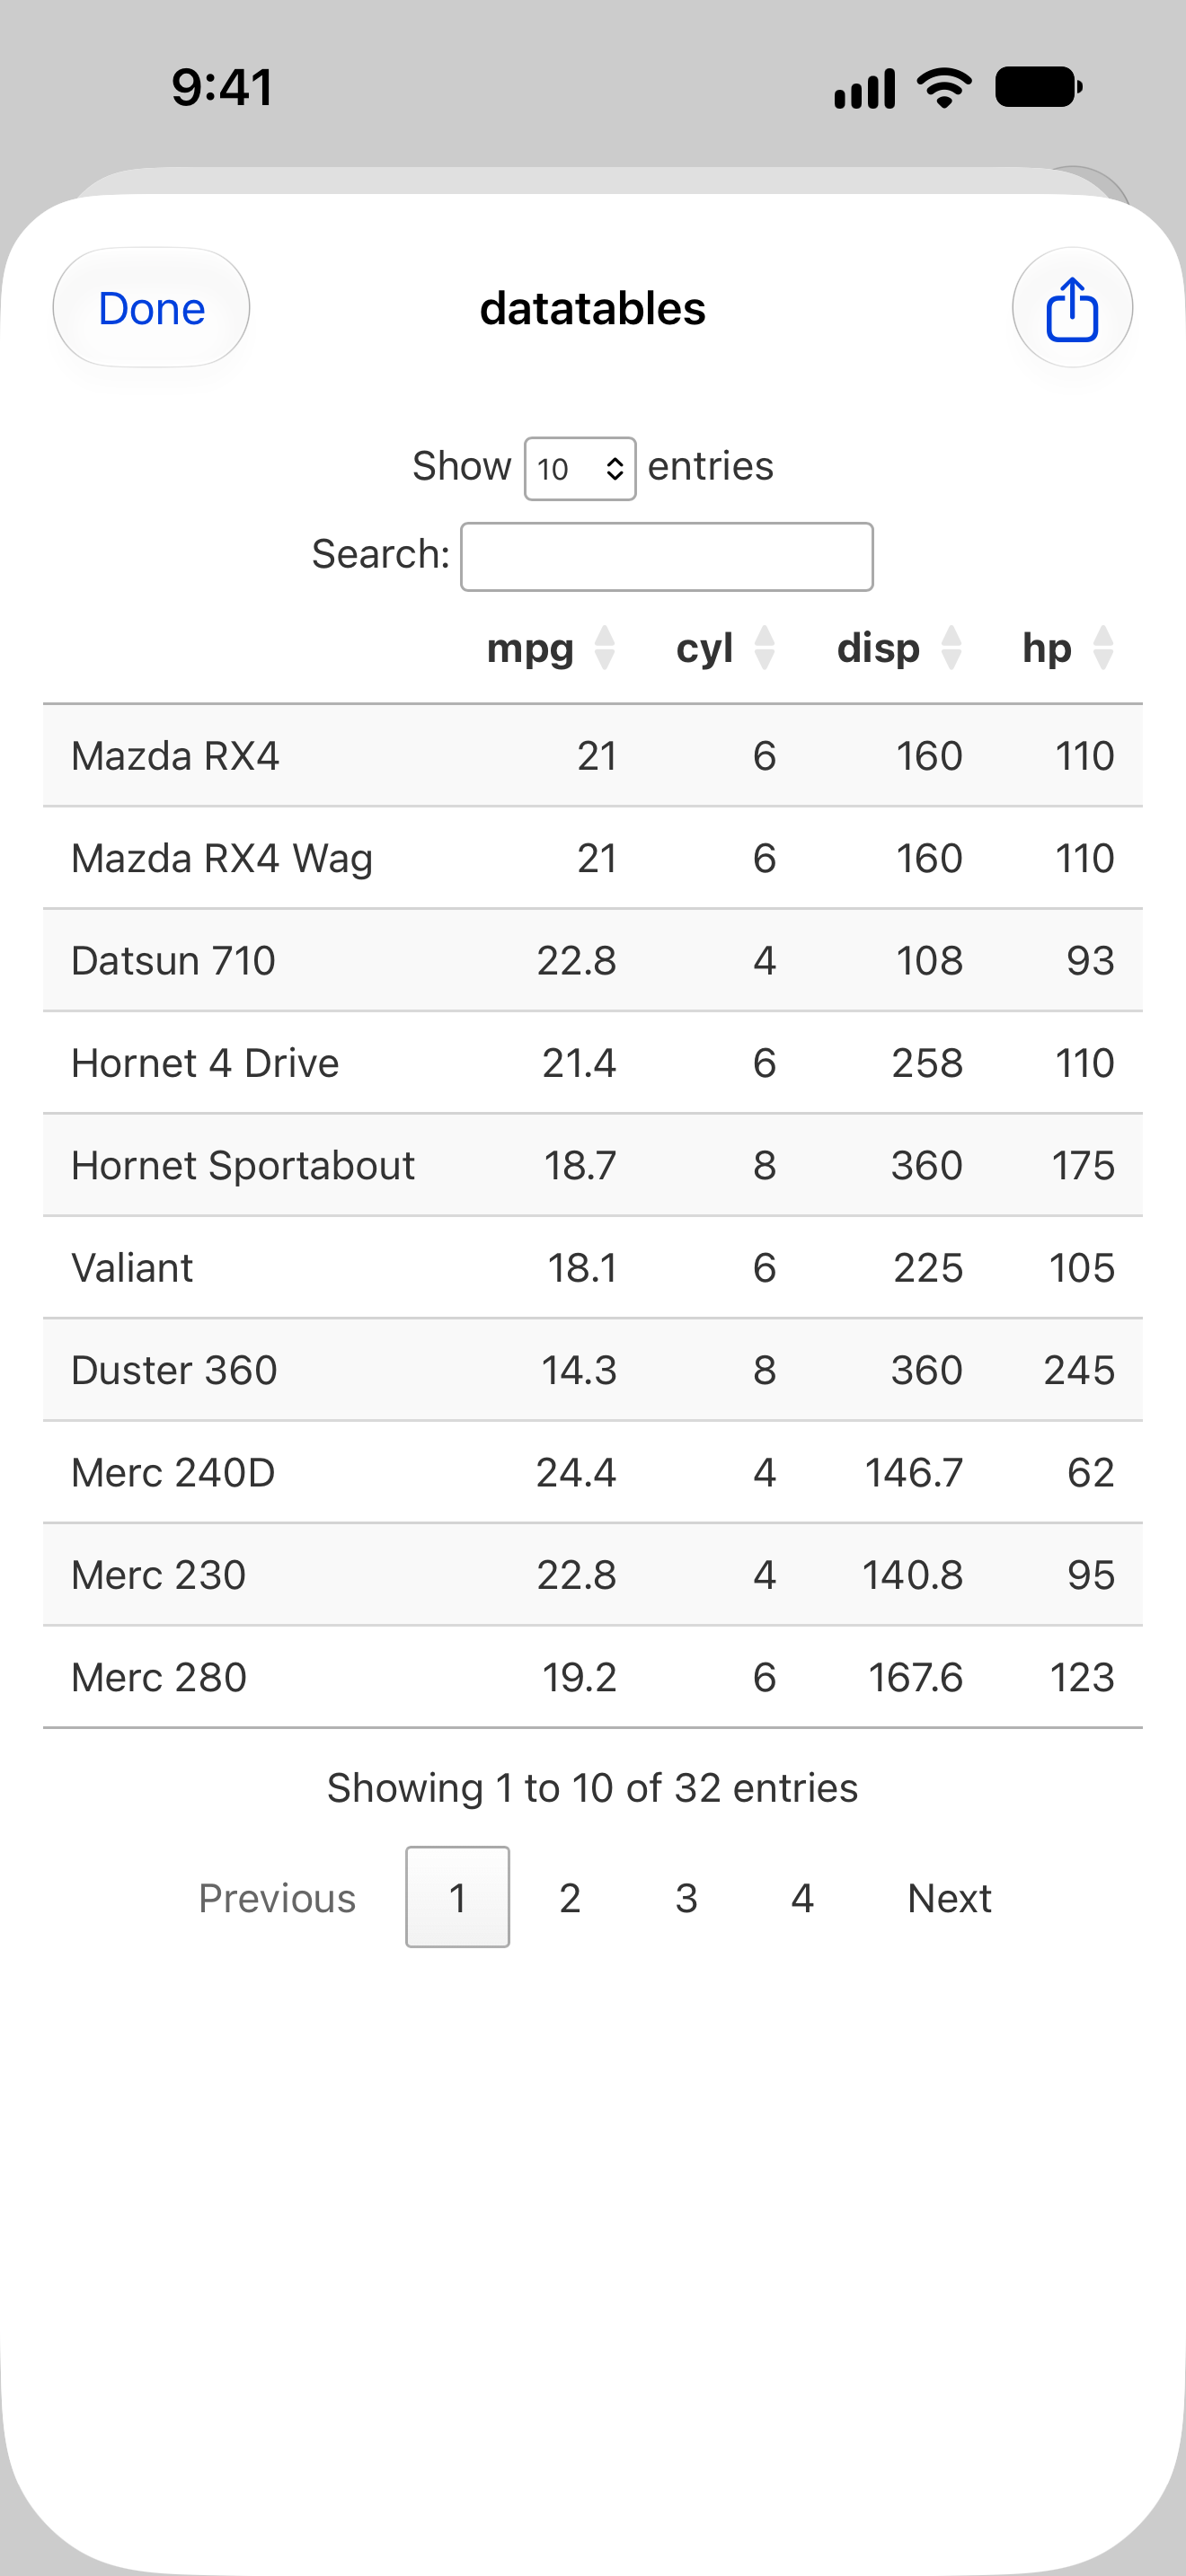
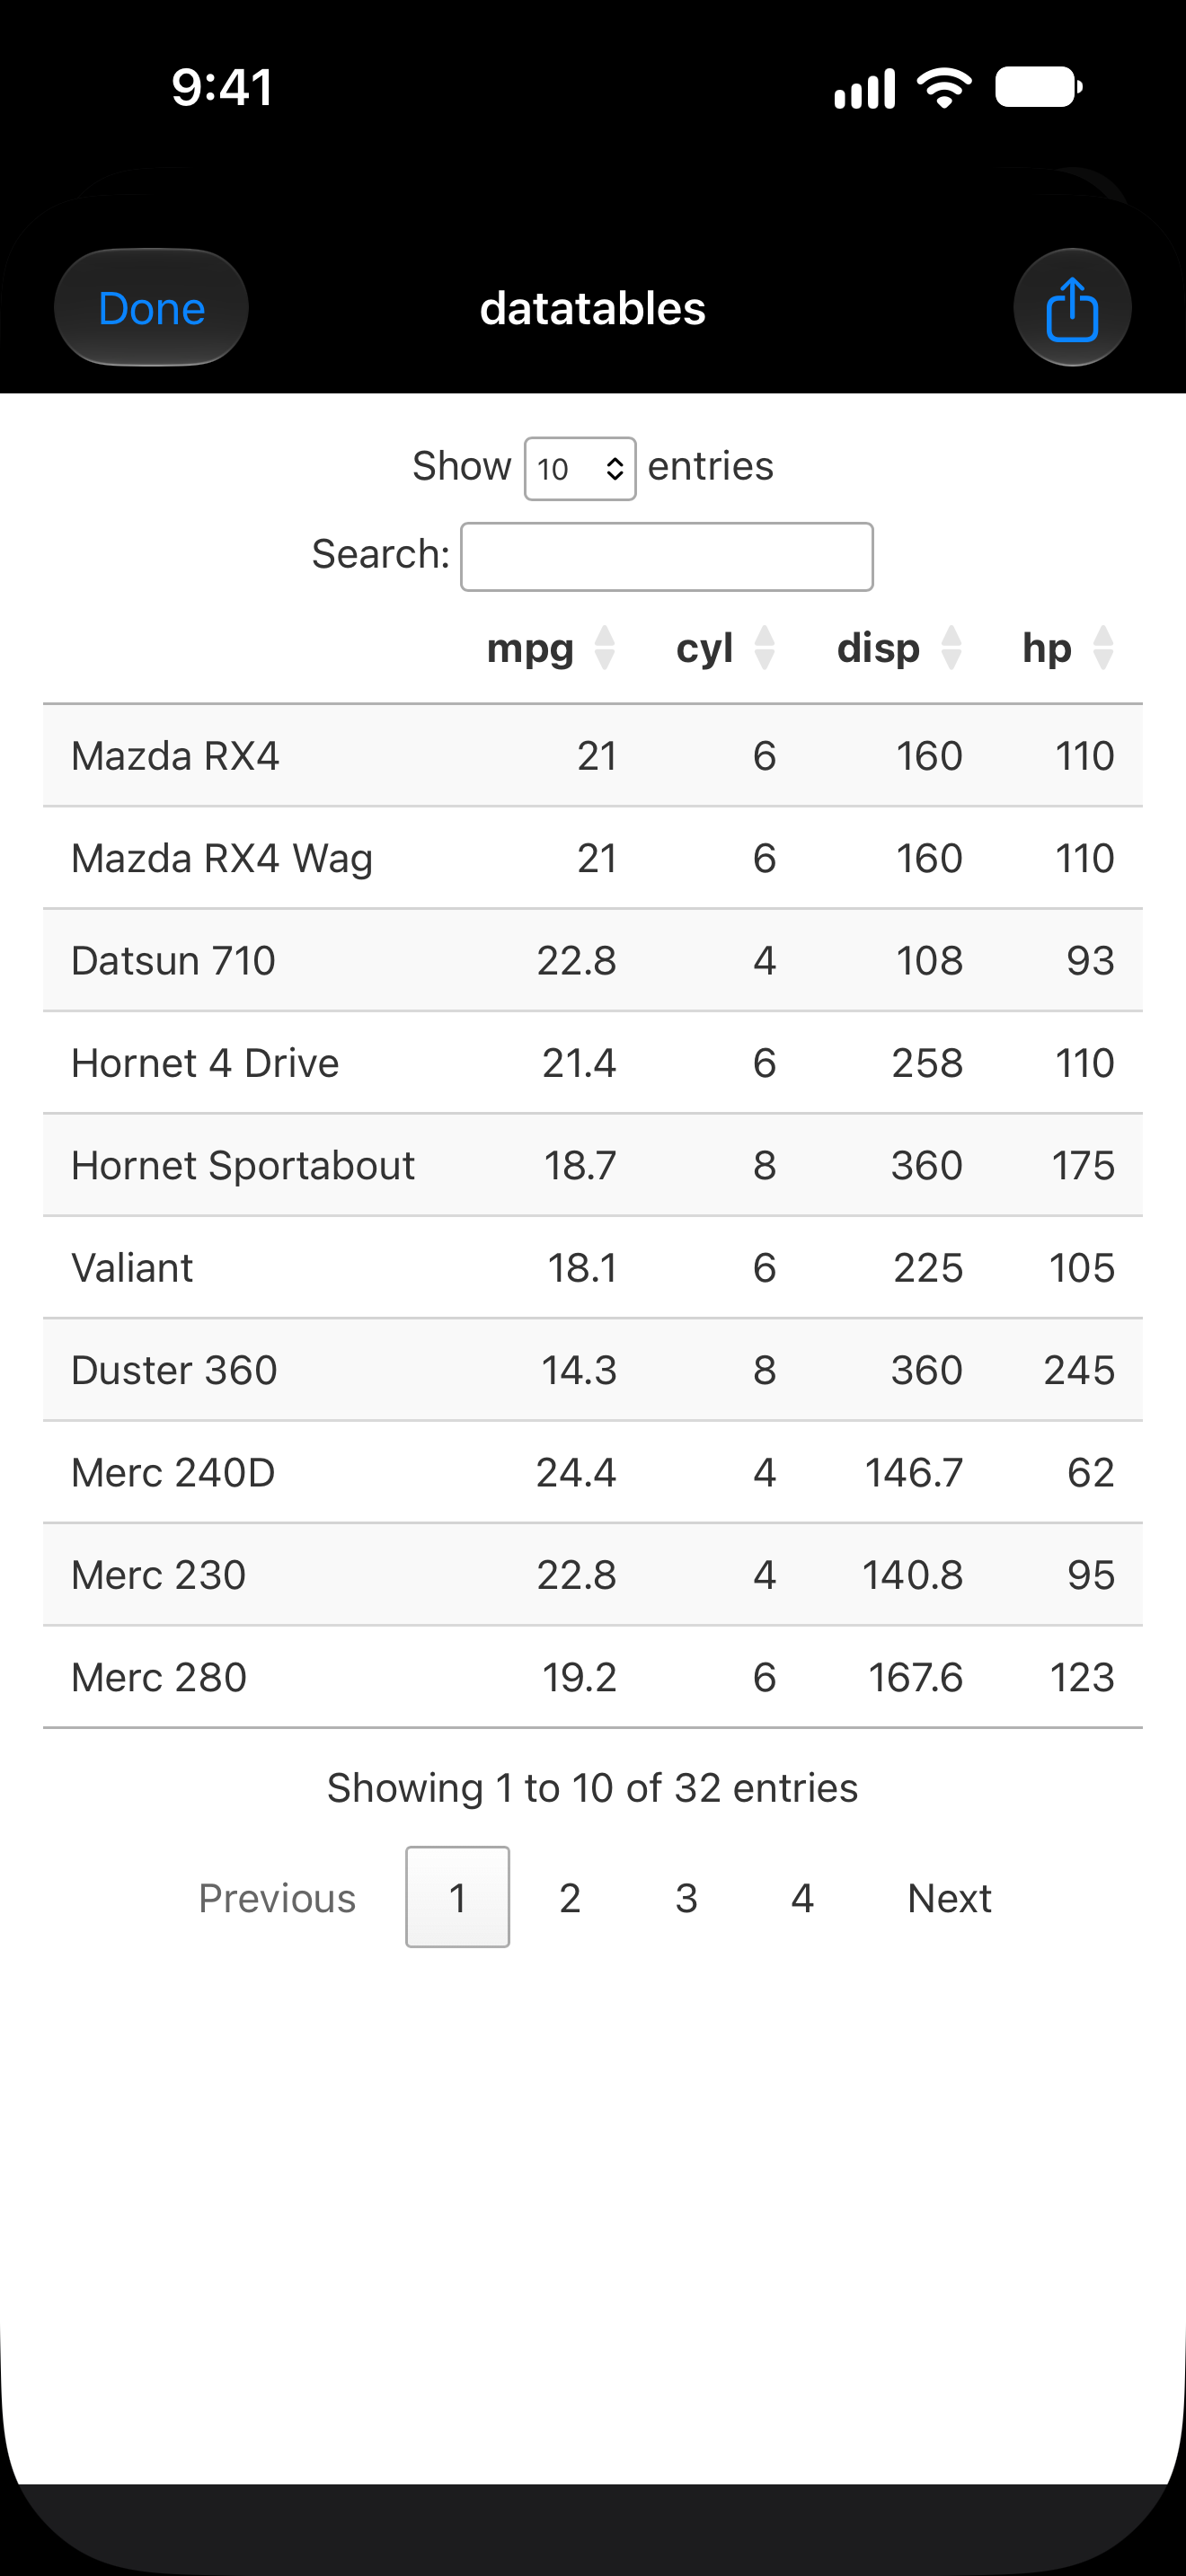
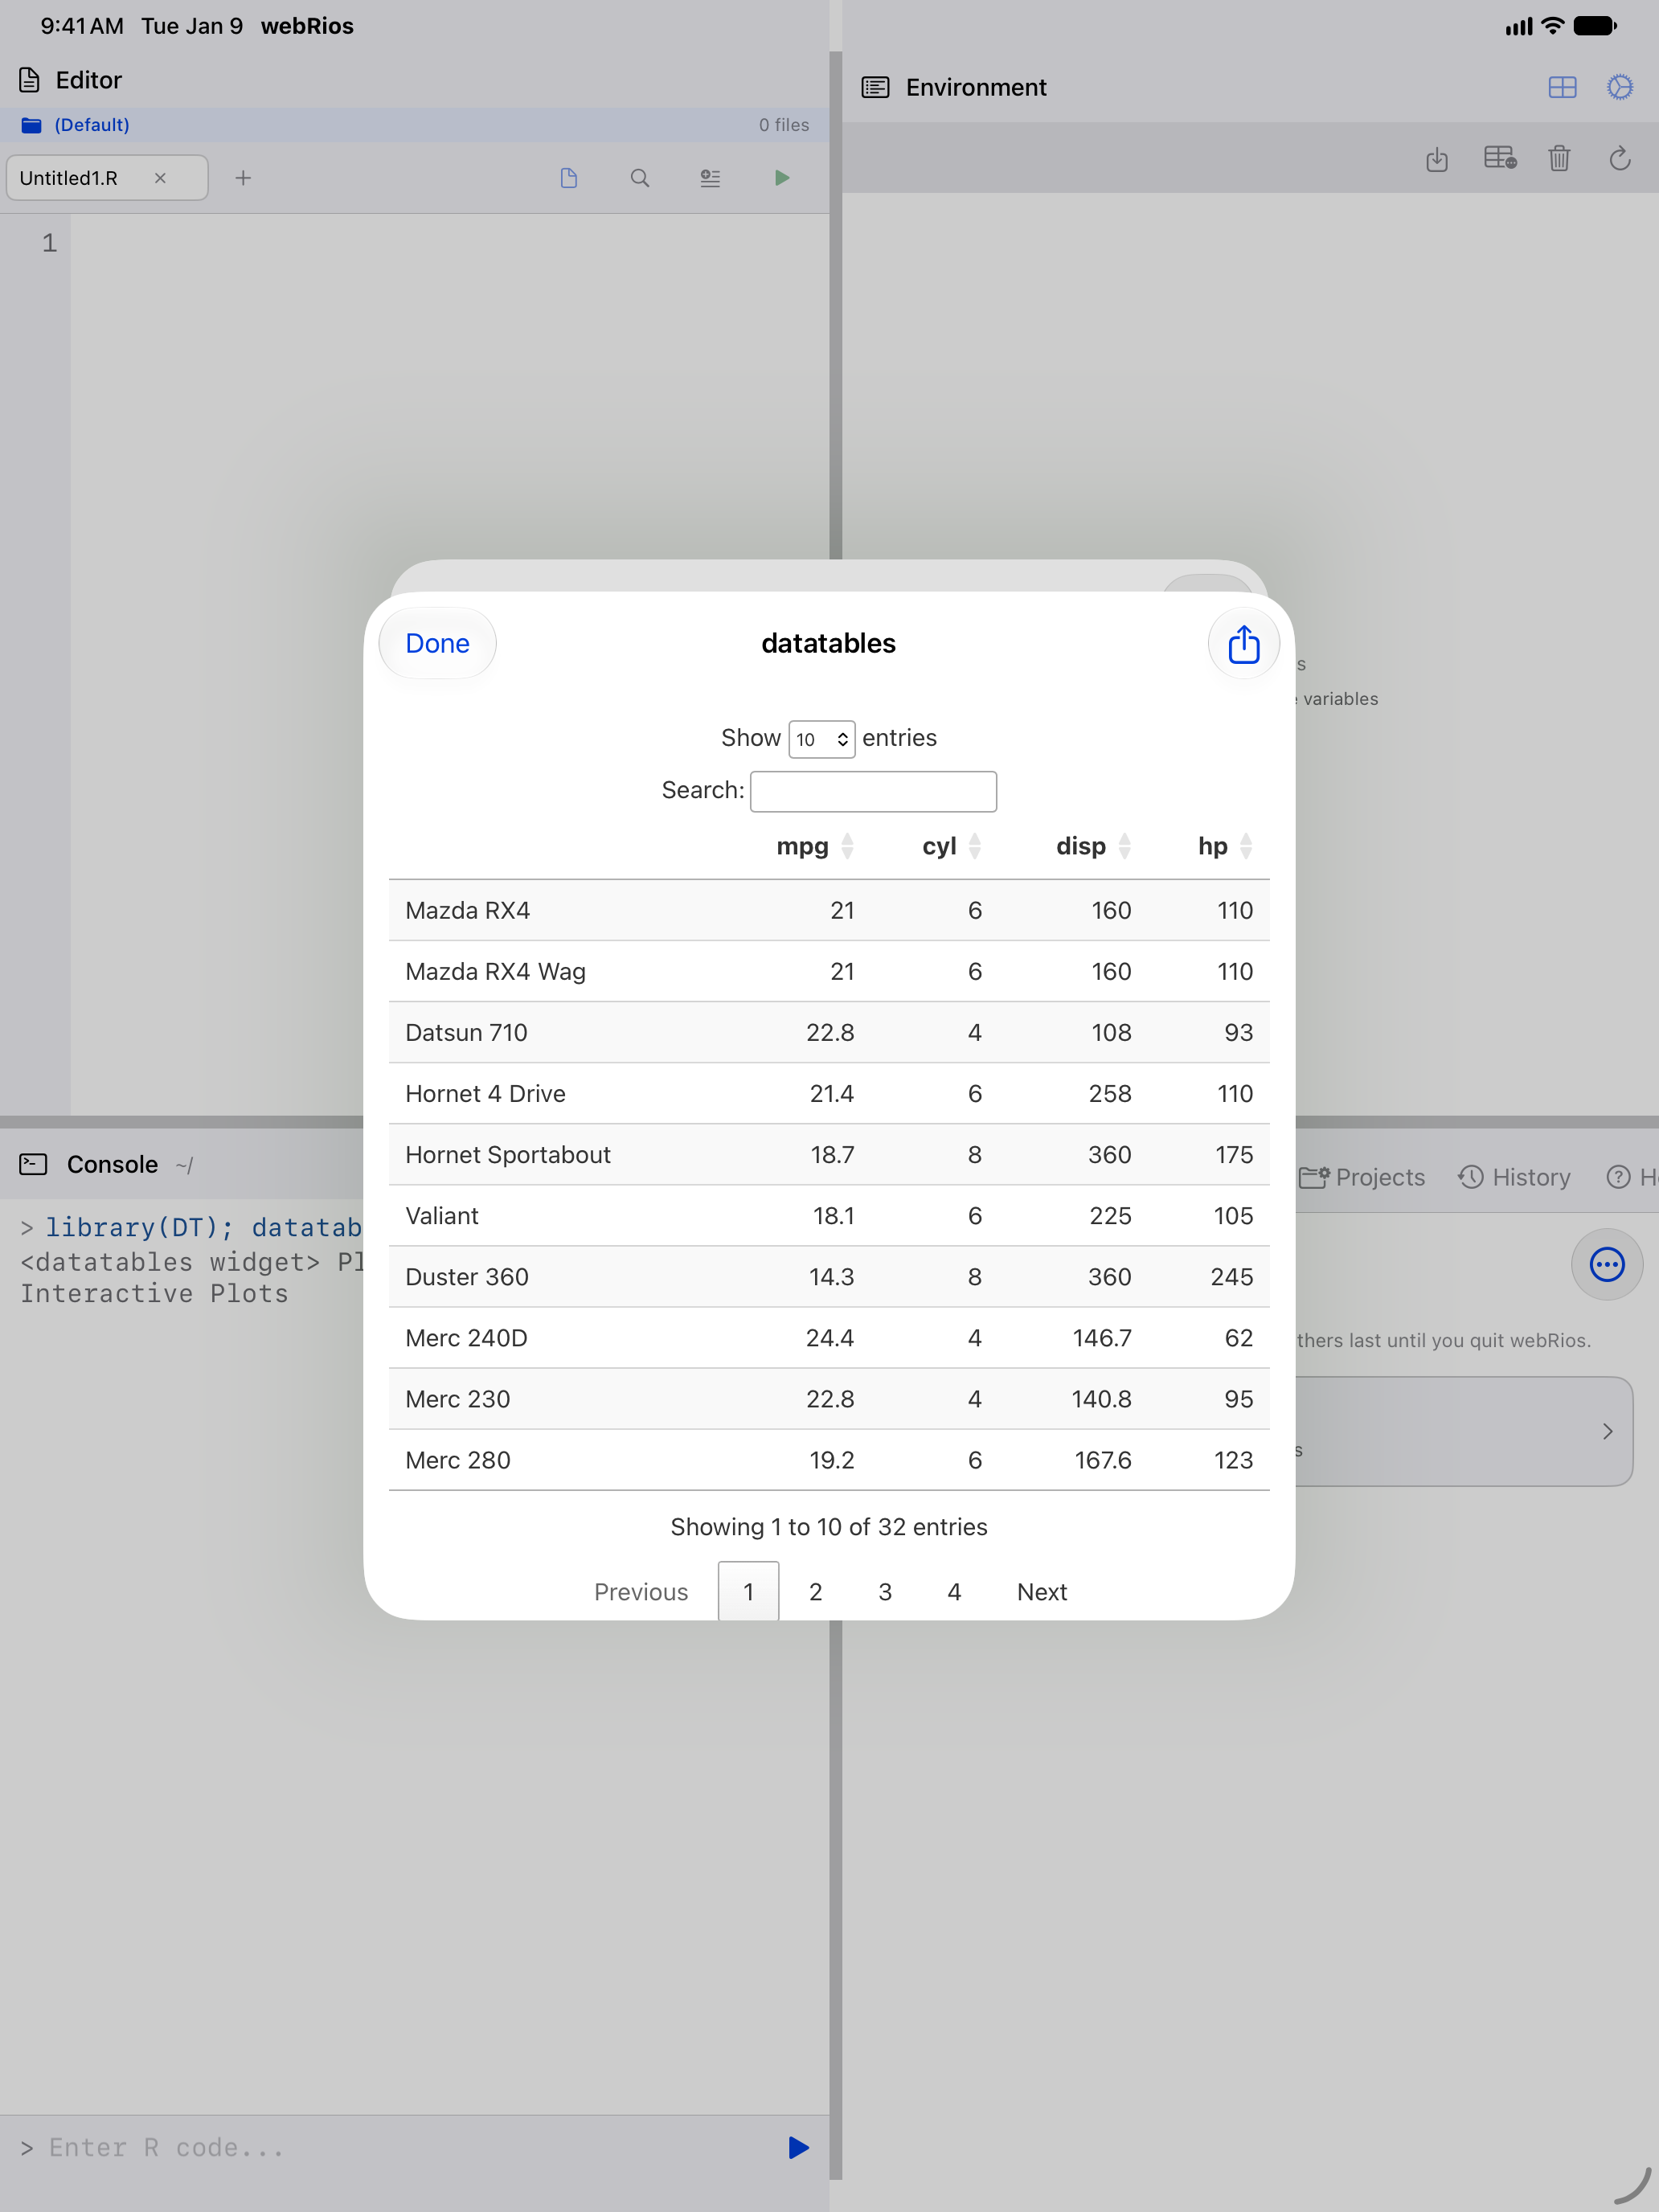
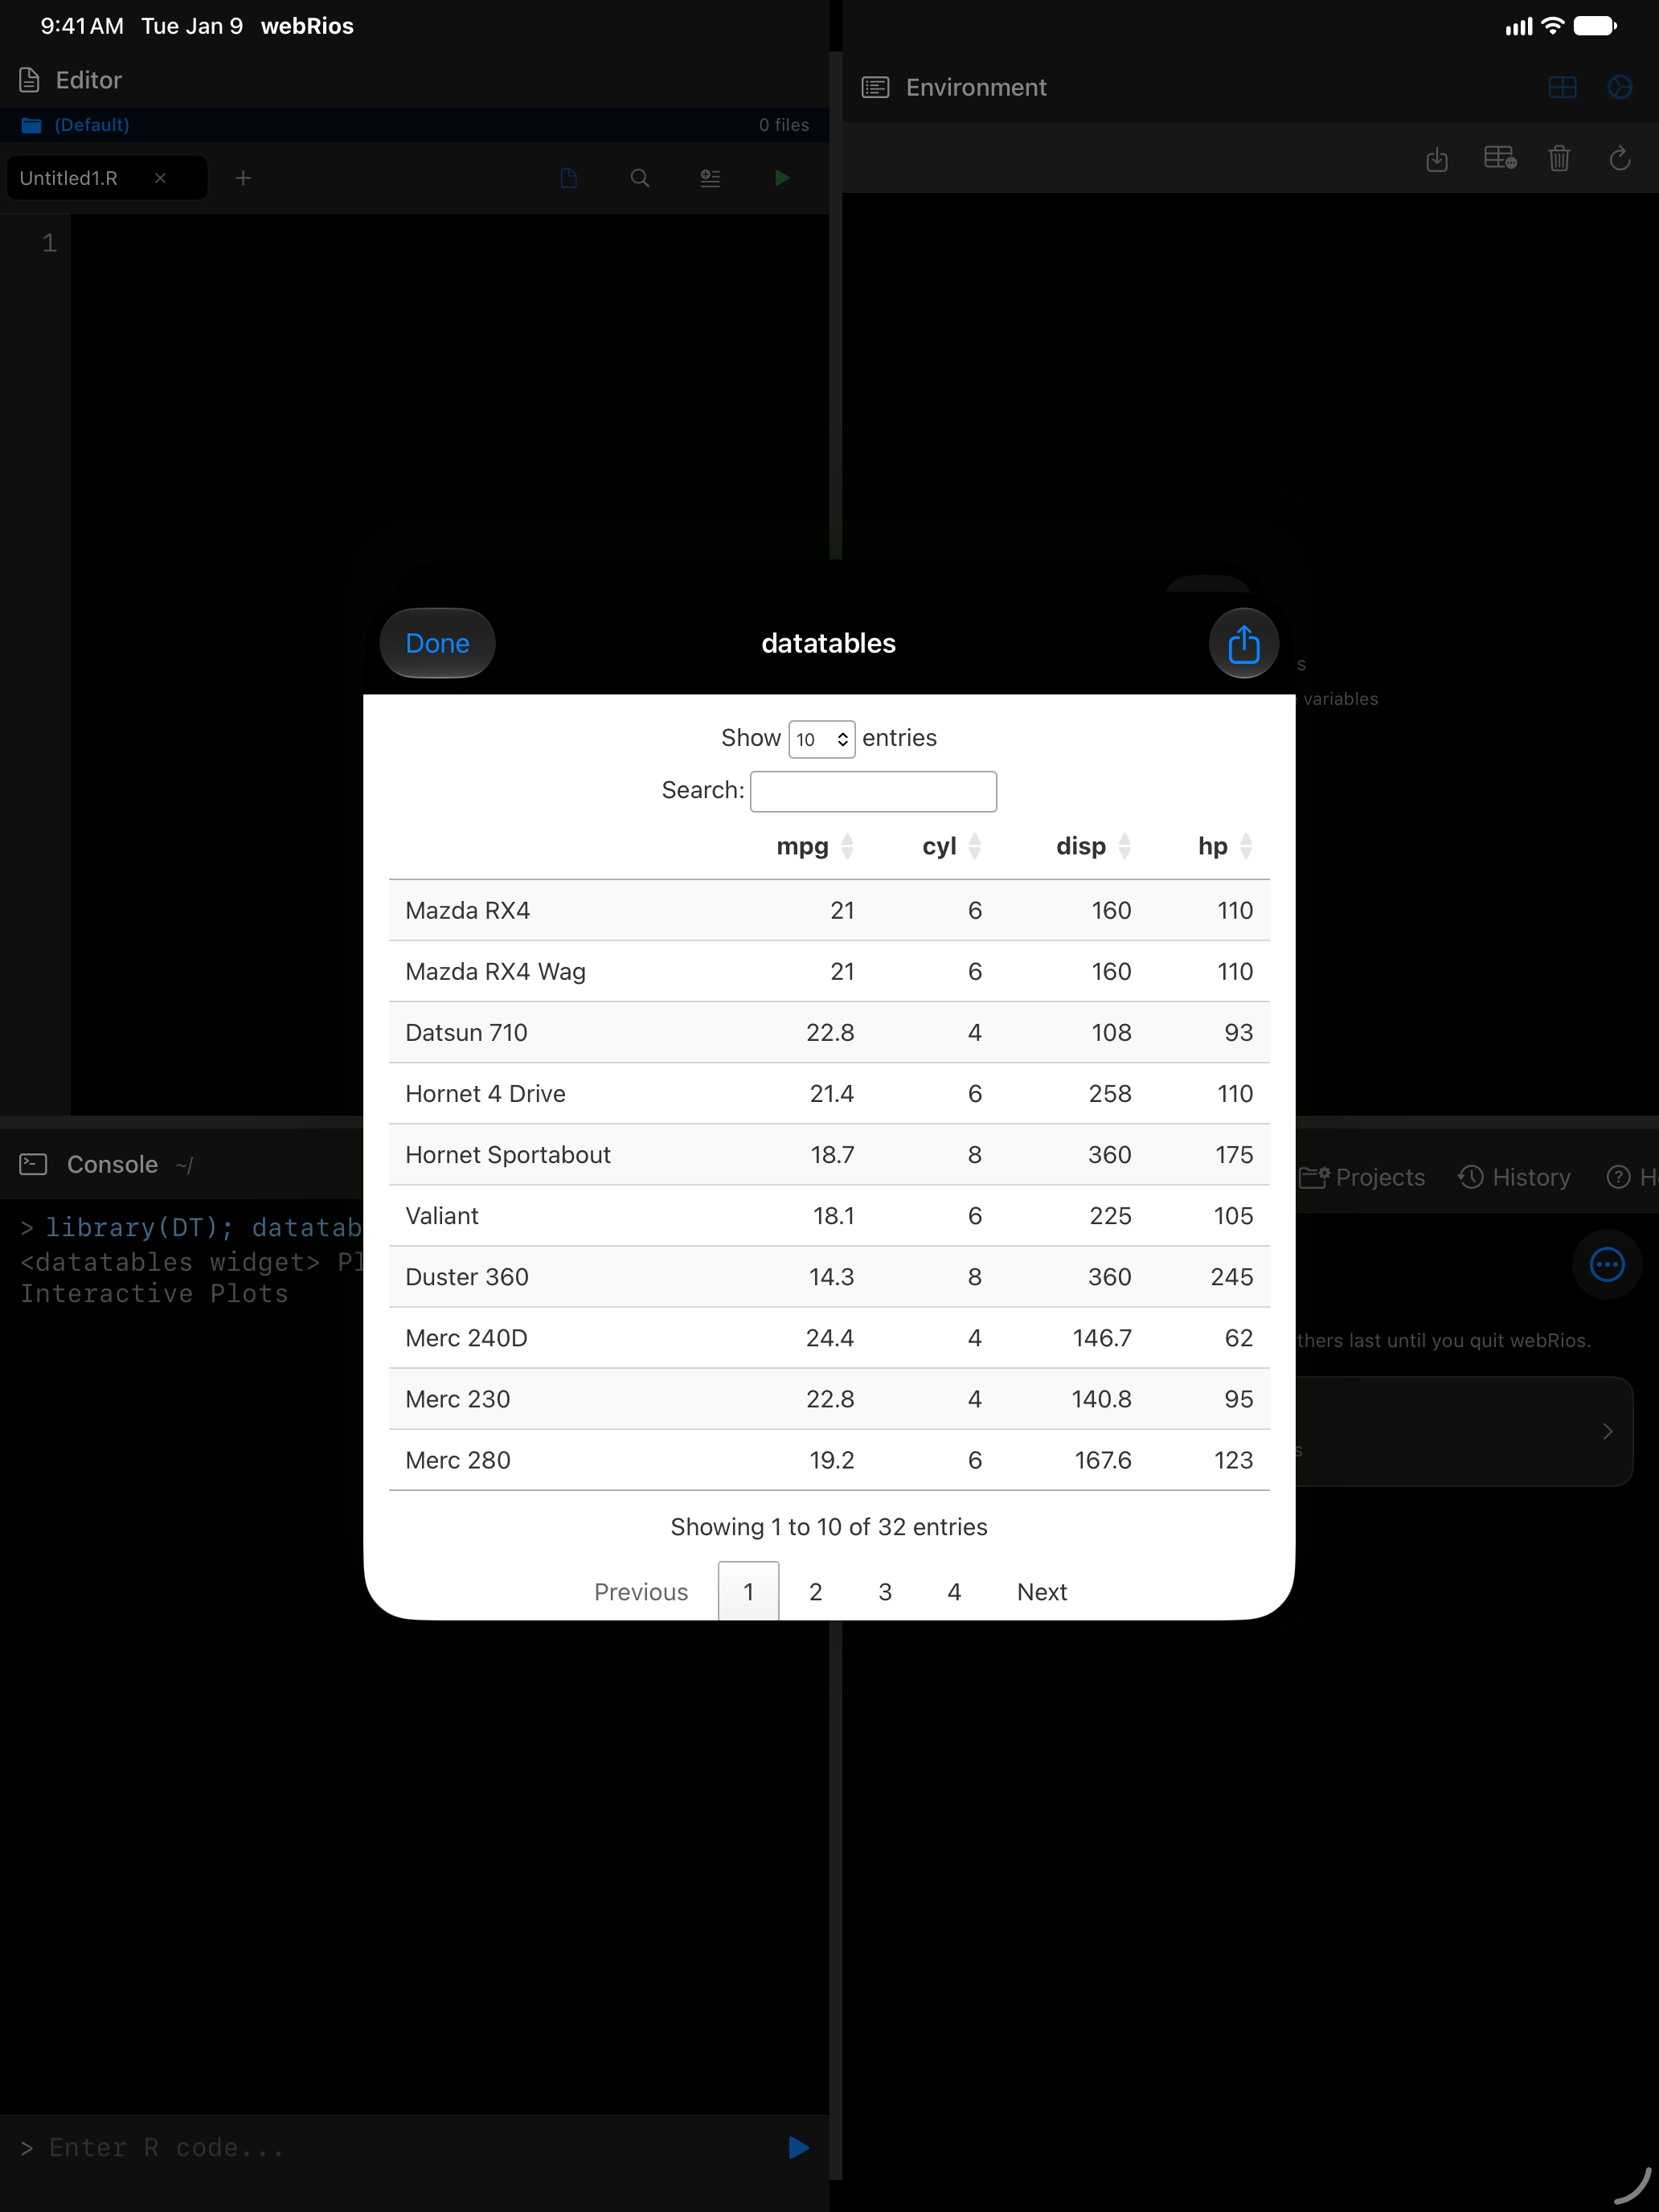
Each widget is one self-contained page, so it works offline. That also makes it large (a bare leaflet map is about 460 KB), which is why widgets live apart from the gallery.
Share a widget from the viewer to get an .html file any browser can open.
Comparing Plots
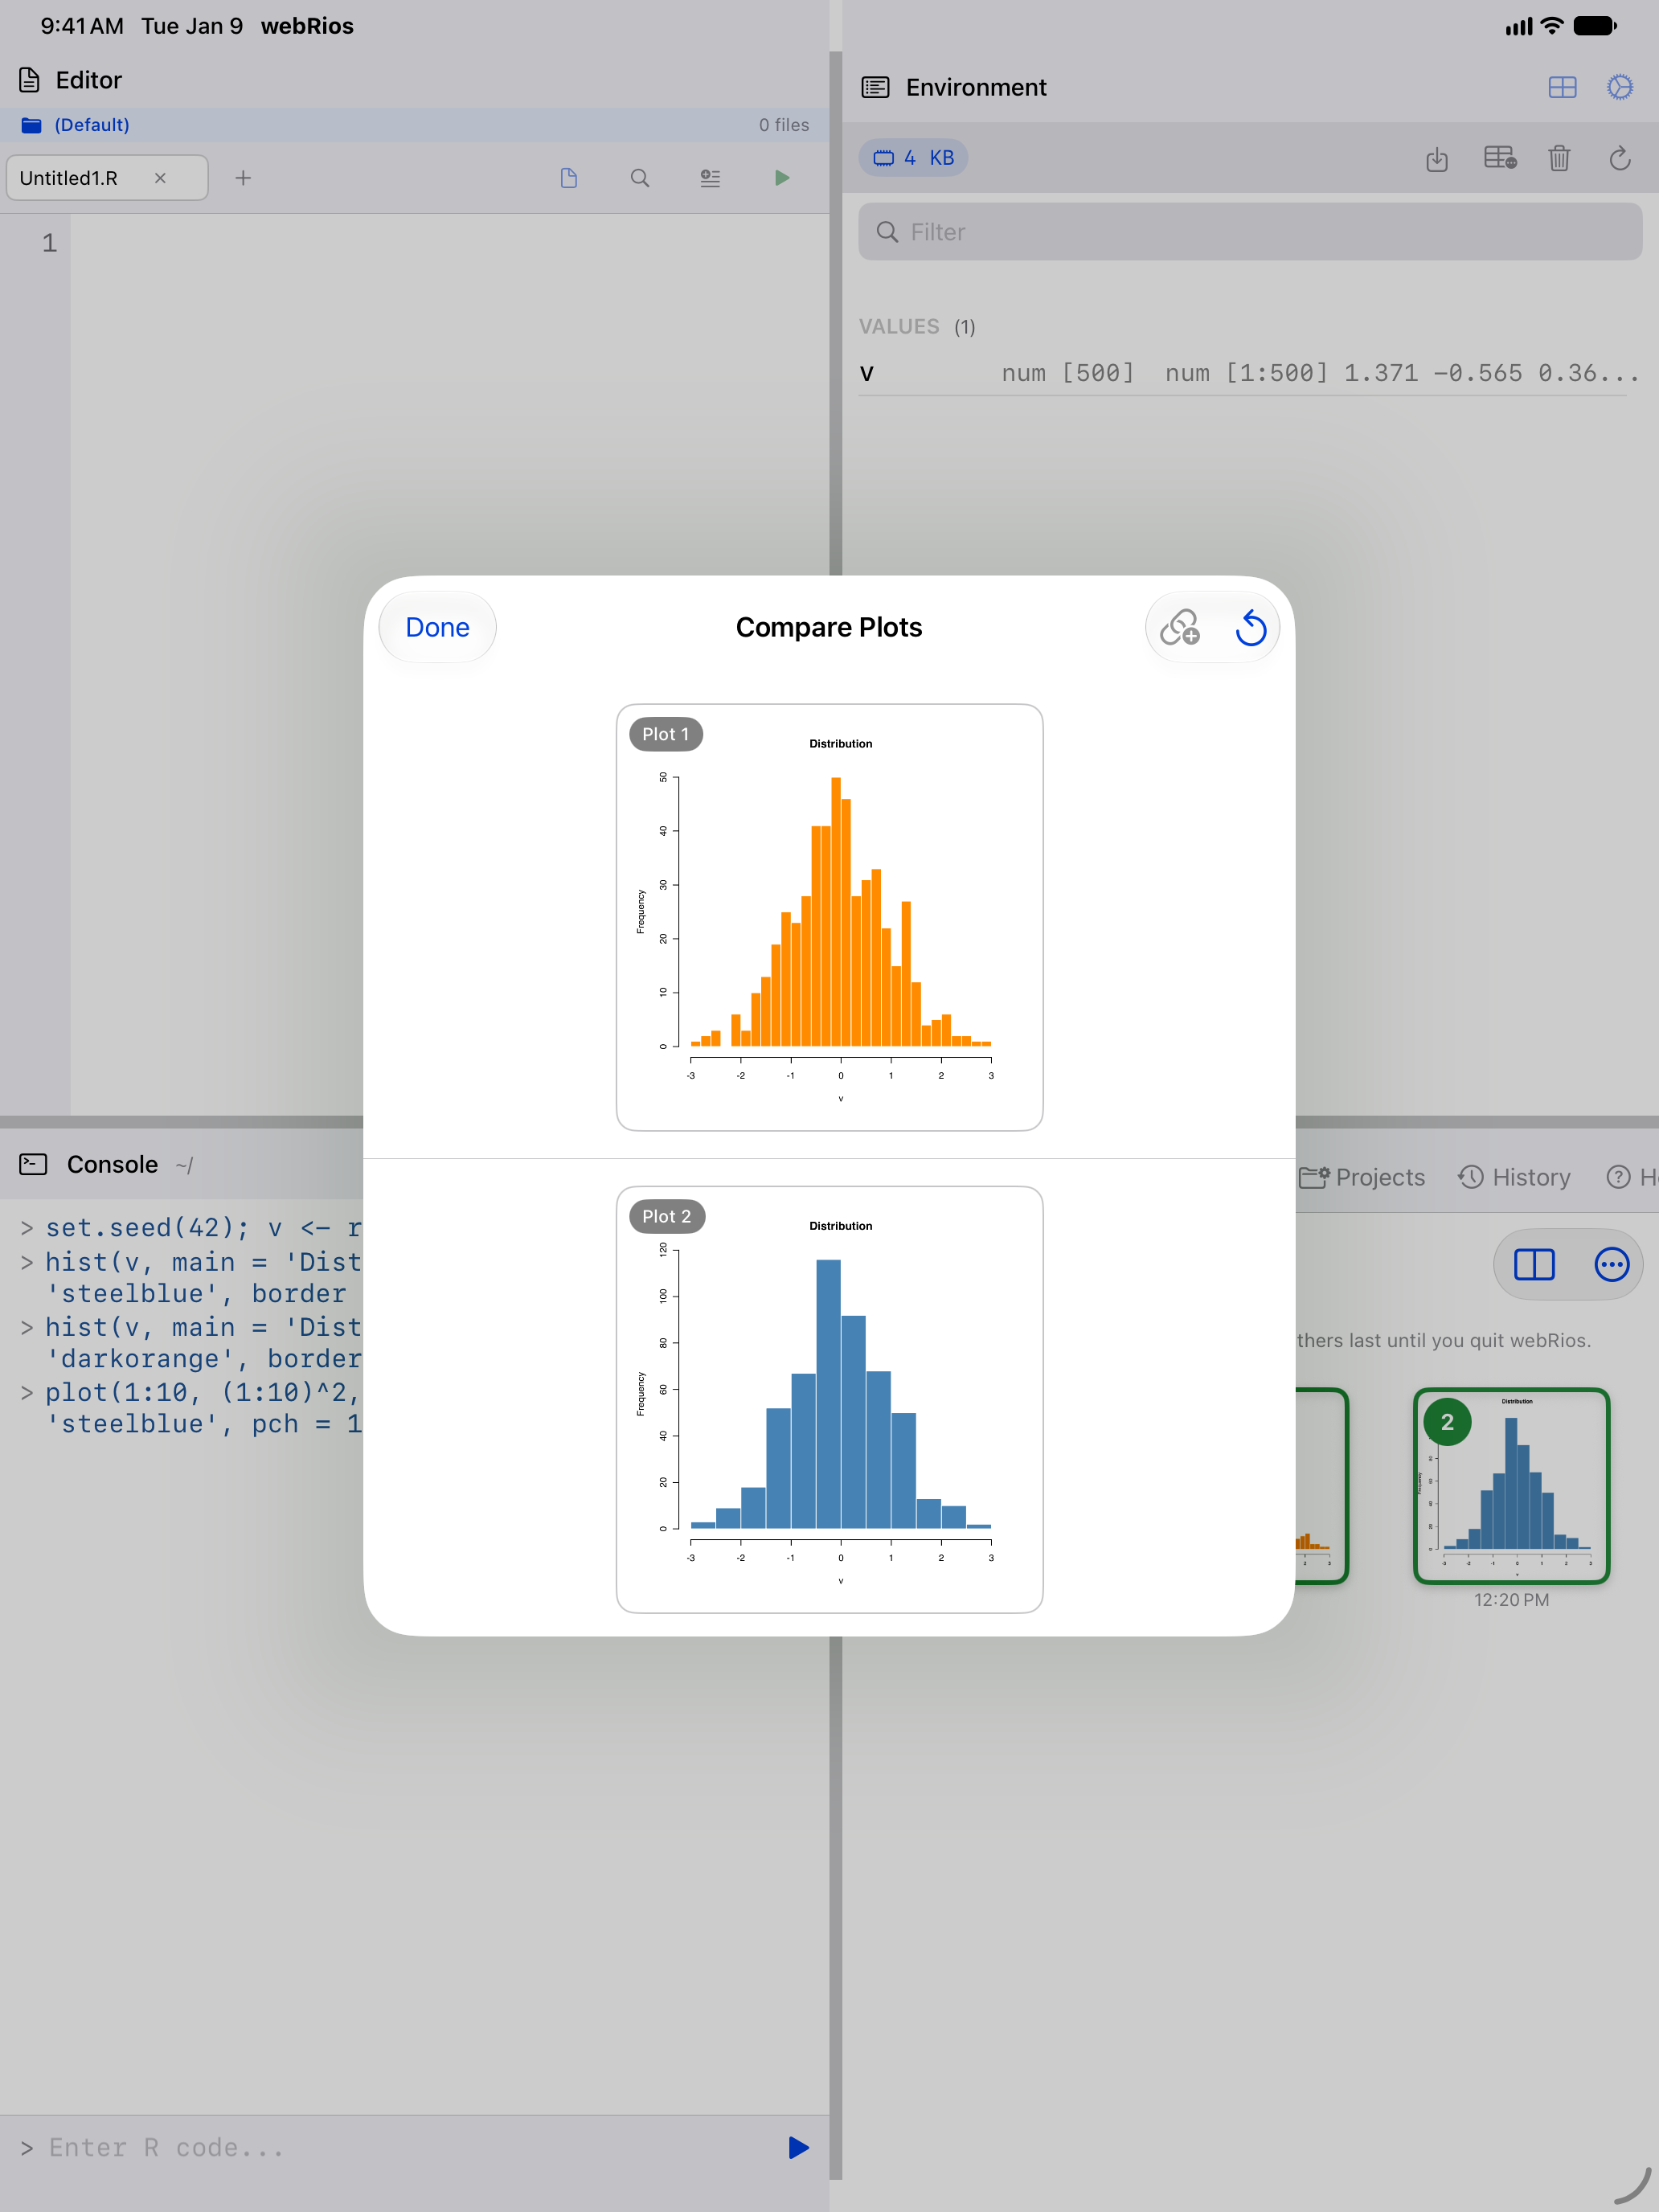
Compare two plots to see how a change to a visualization affects the result.
To start a comparison:
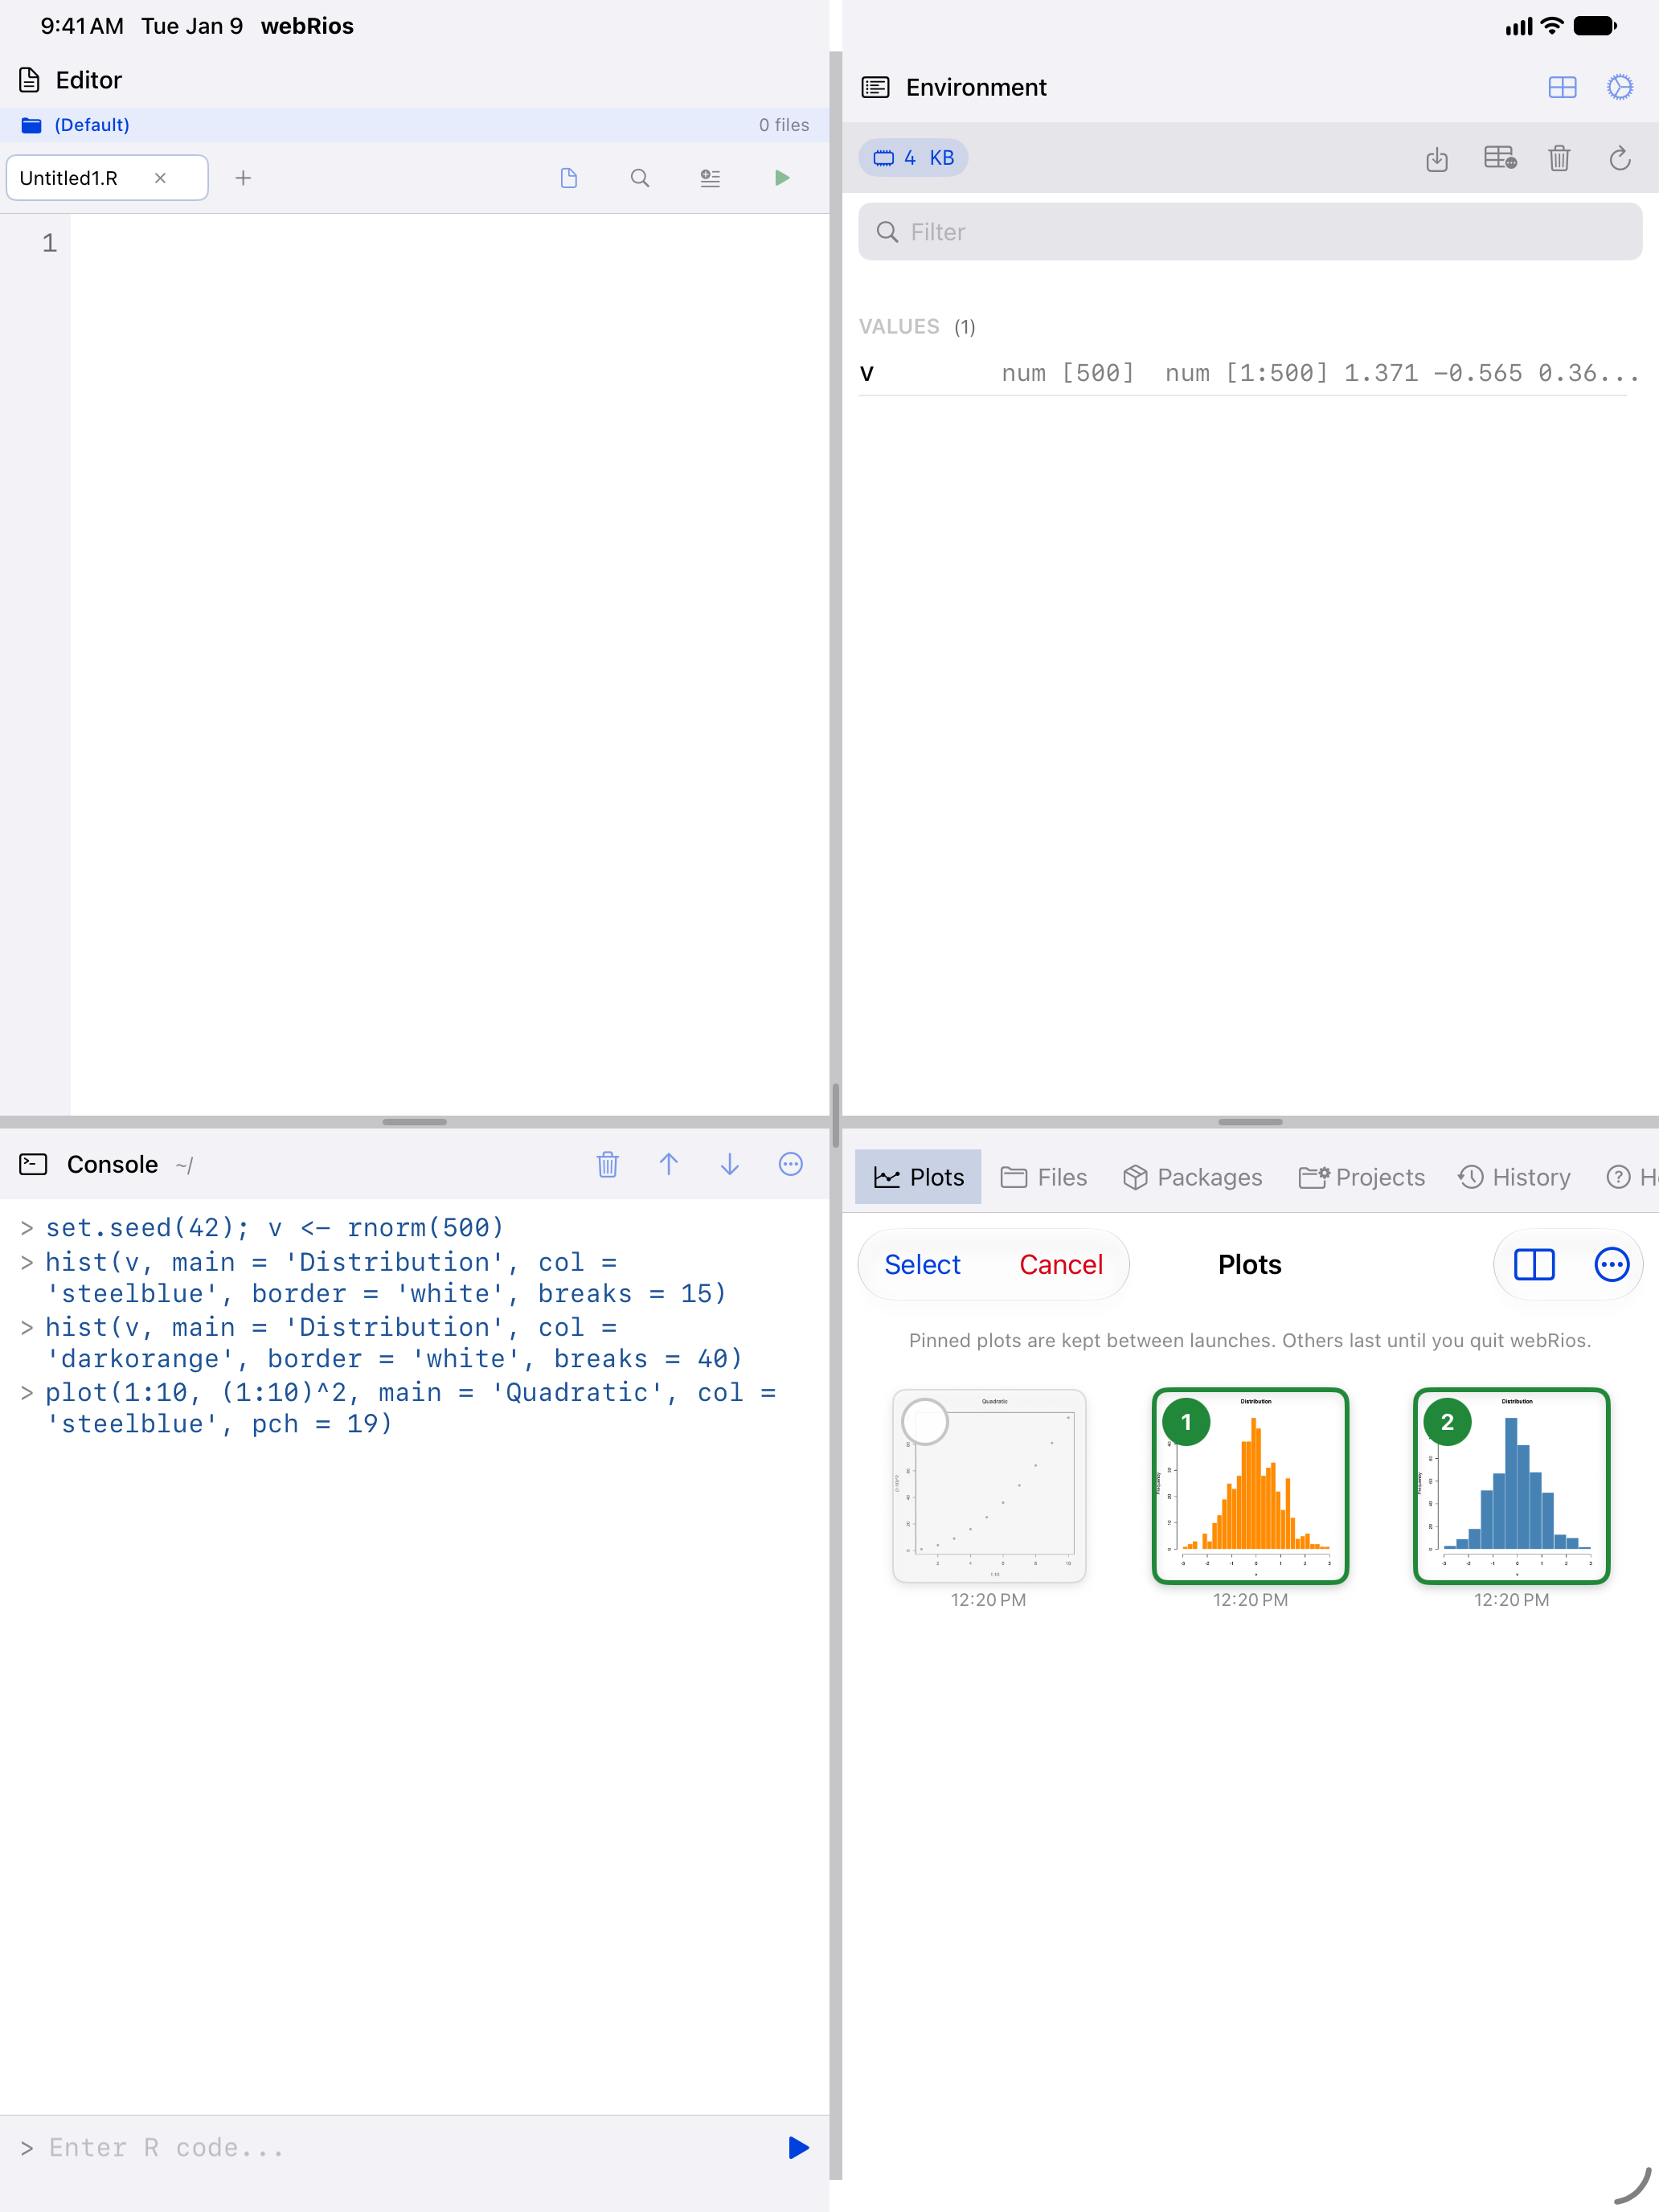
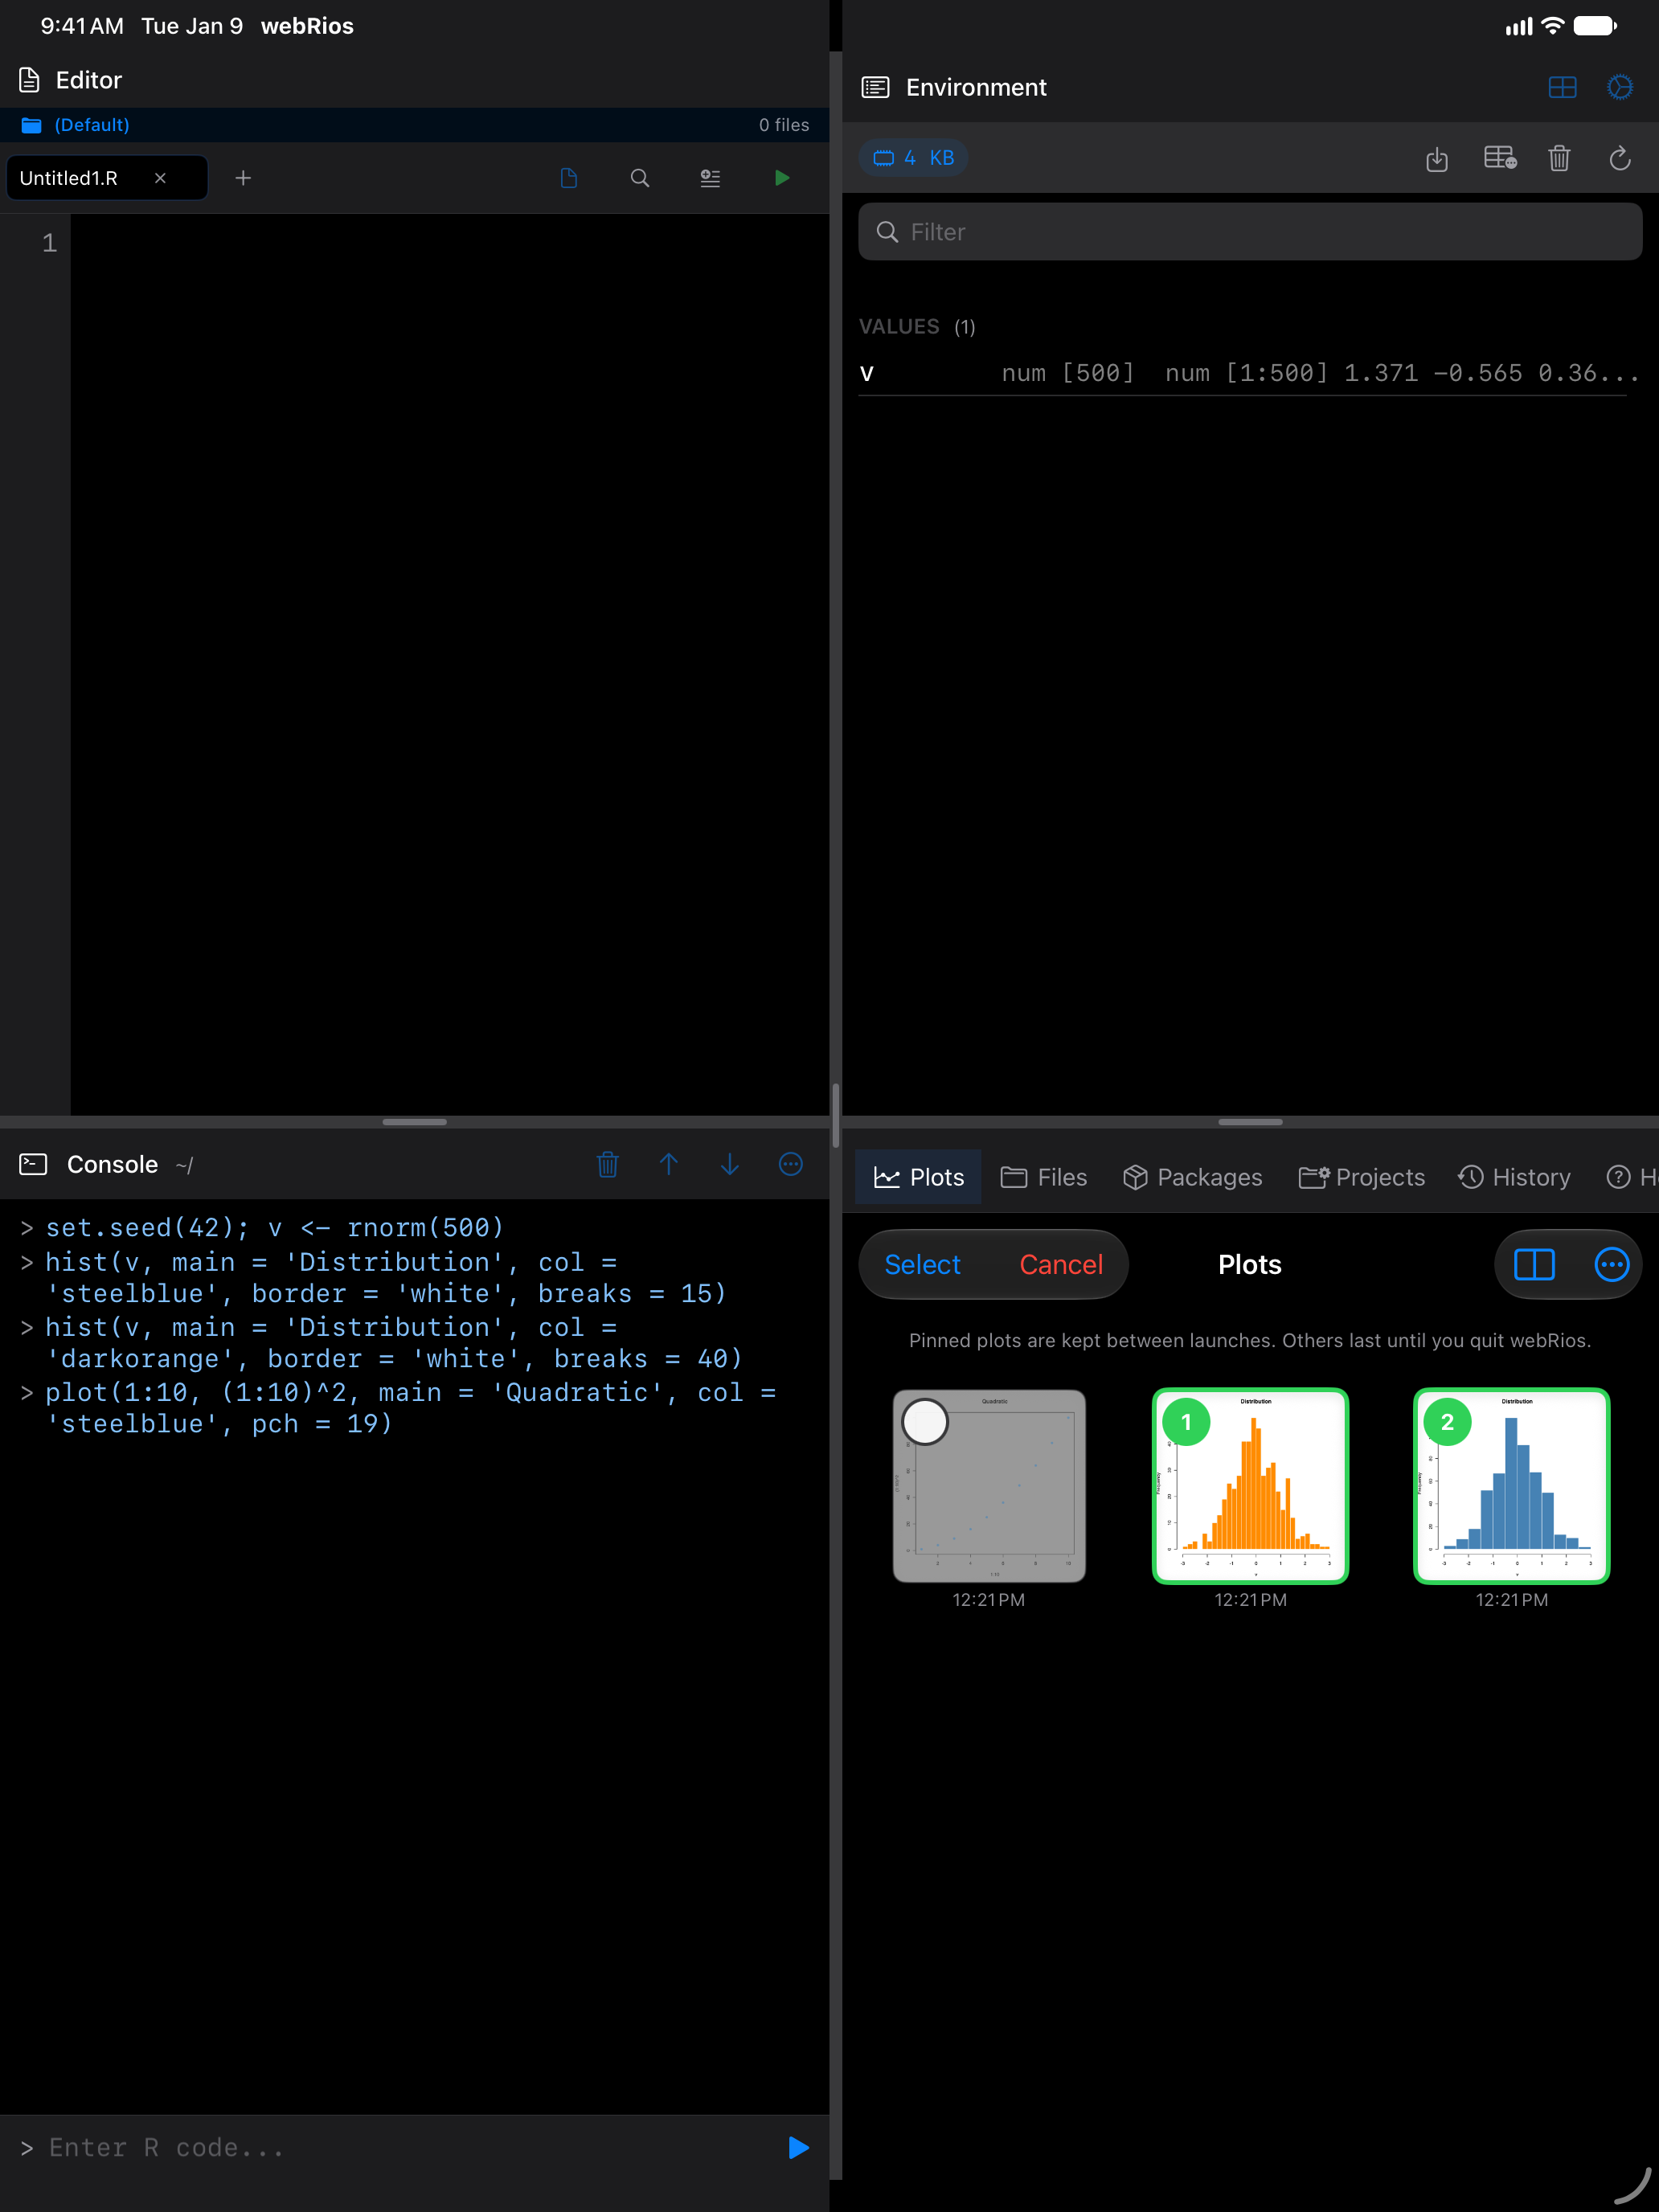
- Tap Compare in the toolbar (it appears when you have at least two plots)
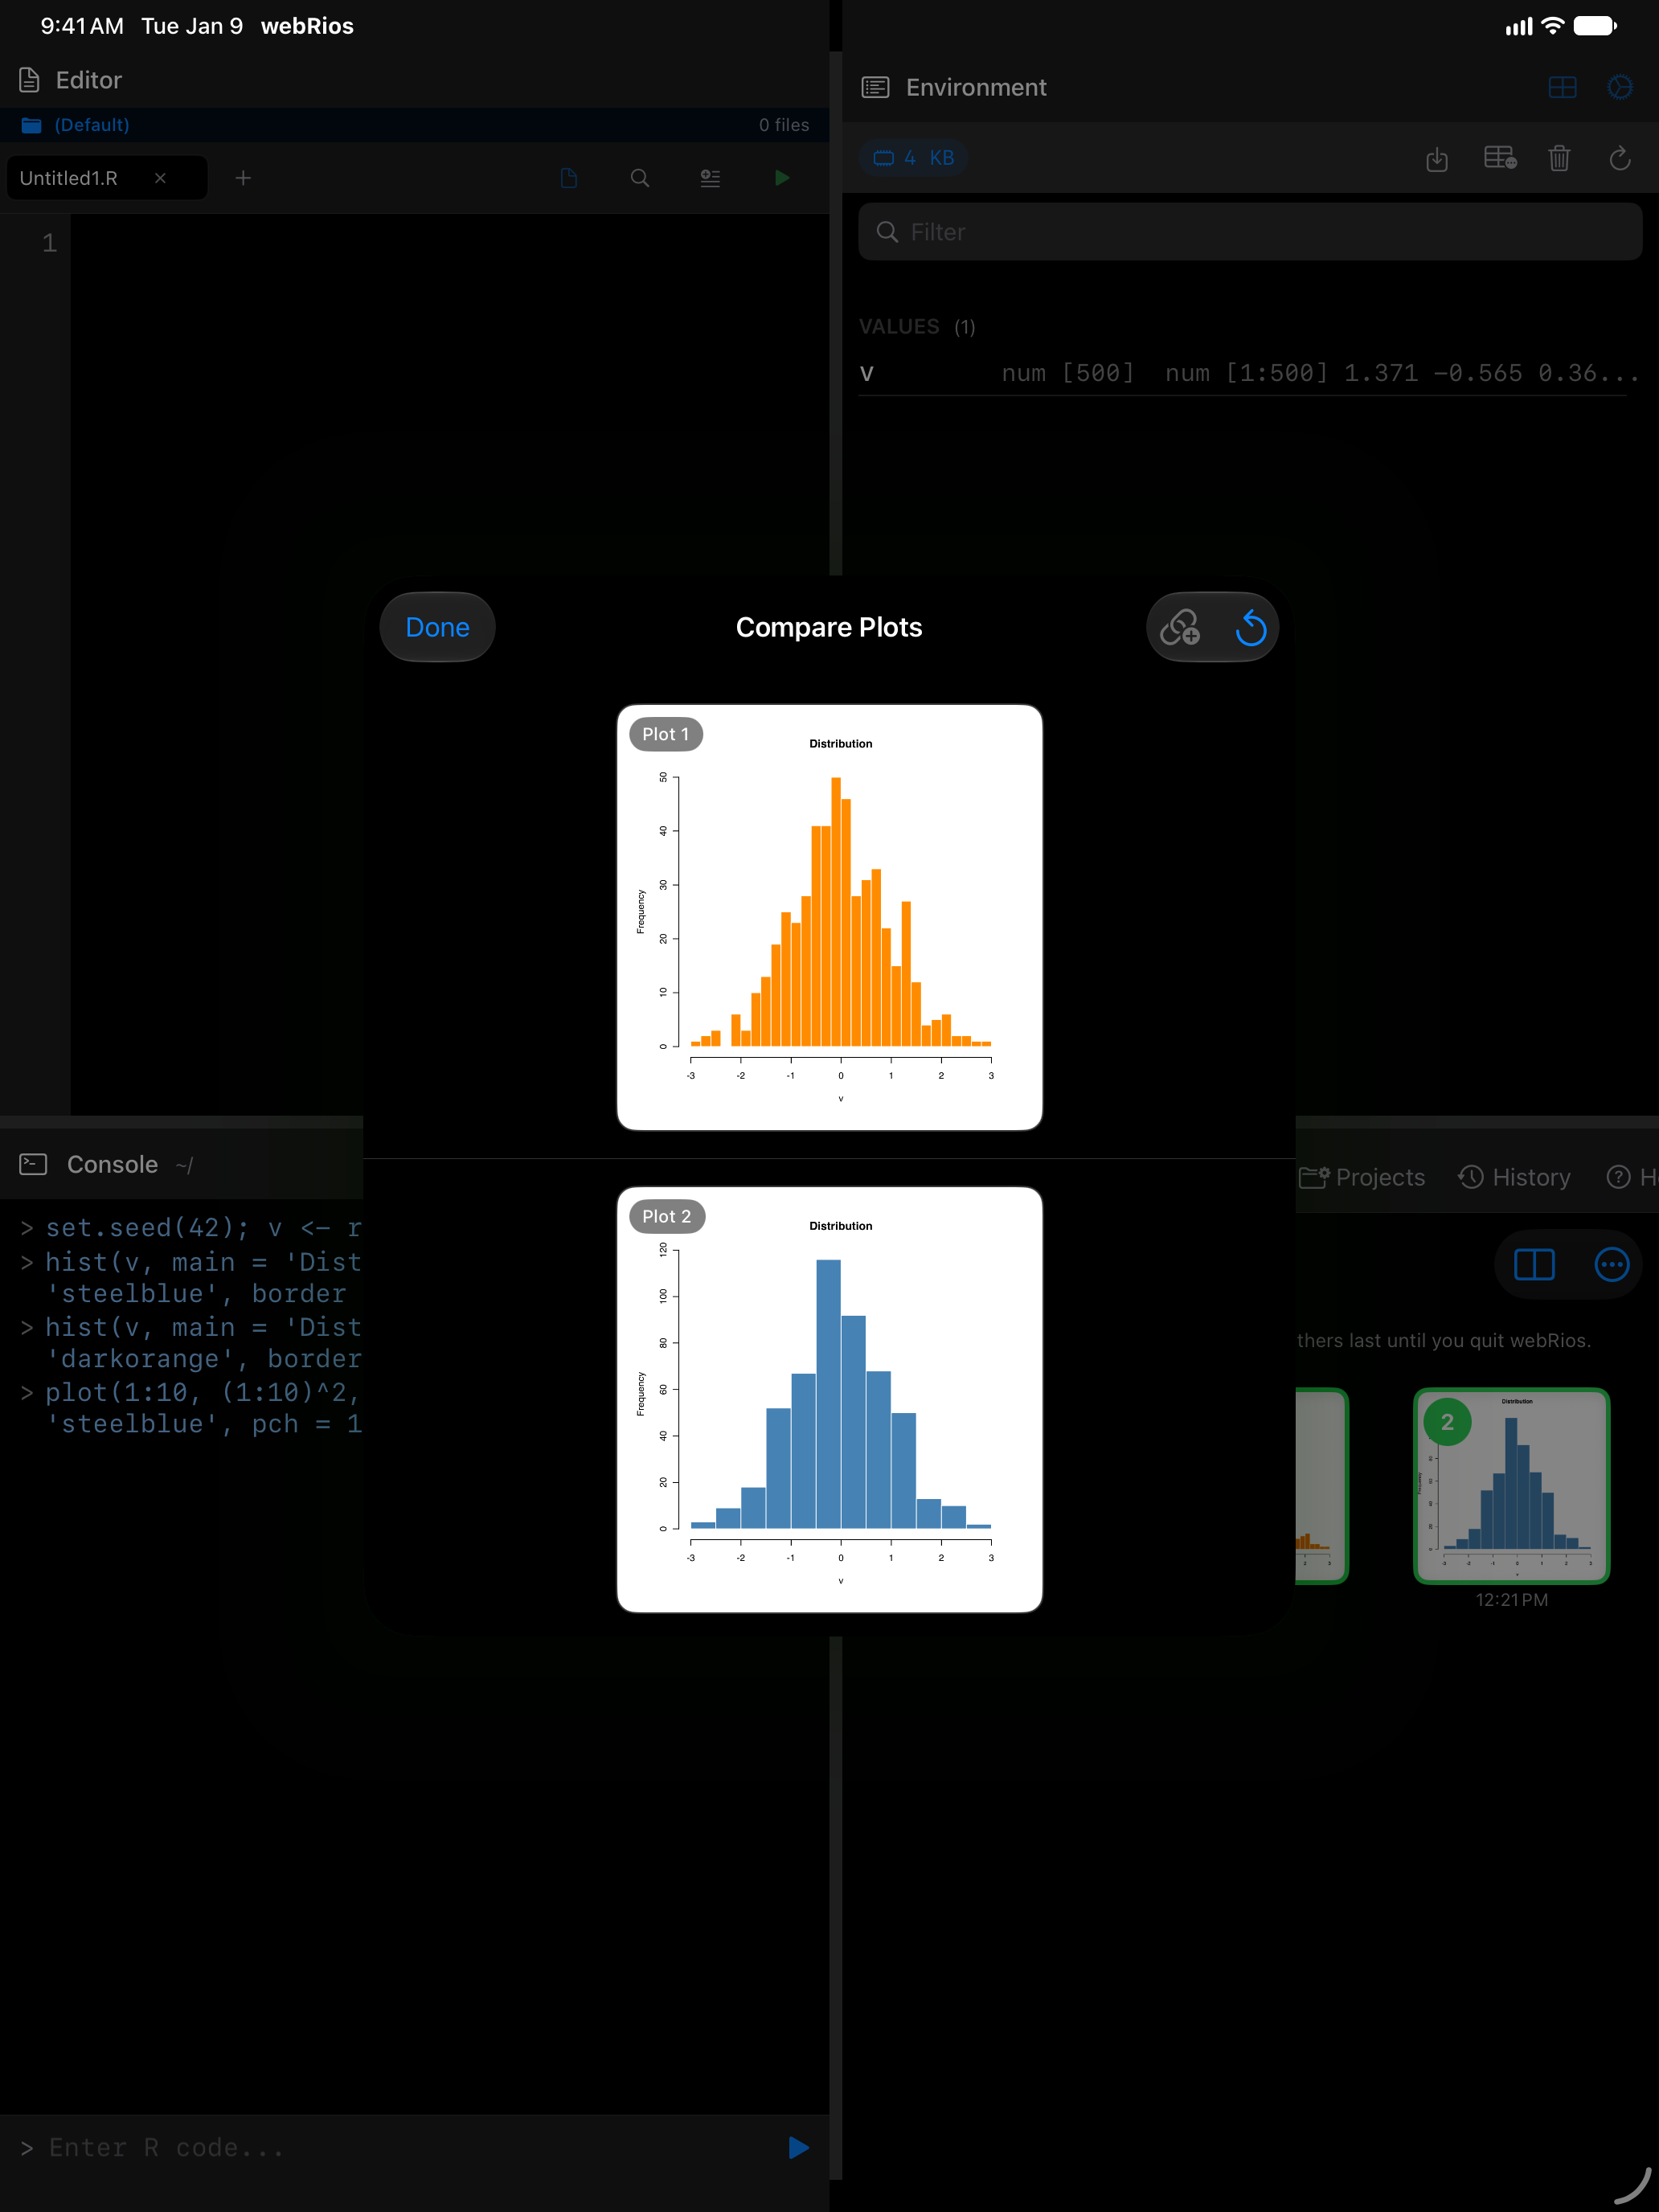
- Tap the two plots you want to compare. They get numbered badges showing which is “Plot 1” and “Plot 2”
- Tap View in the toolbar to open the comparison view
The comparison sheet stacks the two plots, each on a card labeled Plot 1 or Plot 2. On an iPhone in landscape they sit side by side. Sync zoom keeps both at the same zoom and position. Tap the link icon to zoom each on its own.
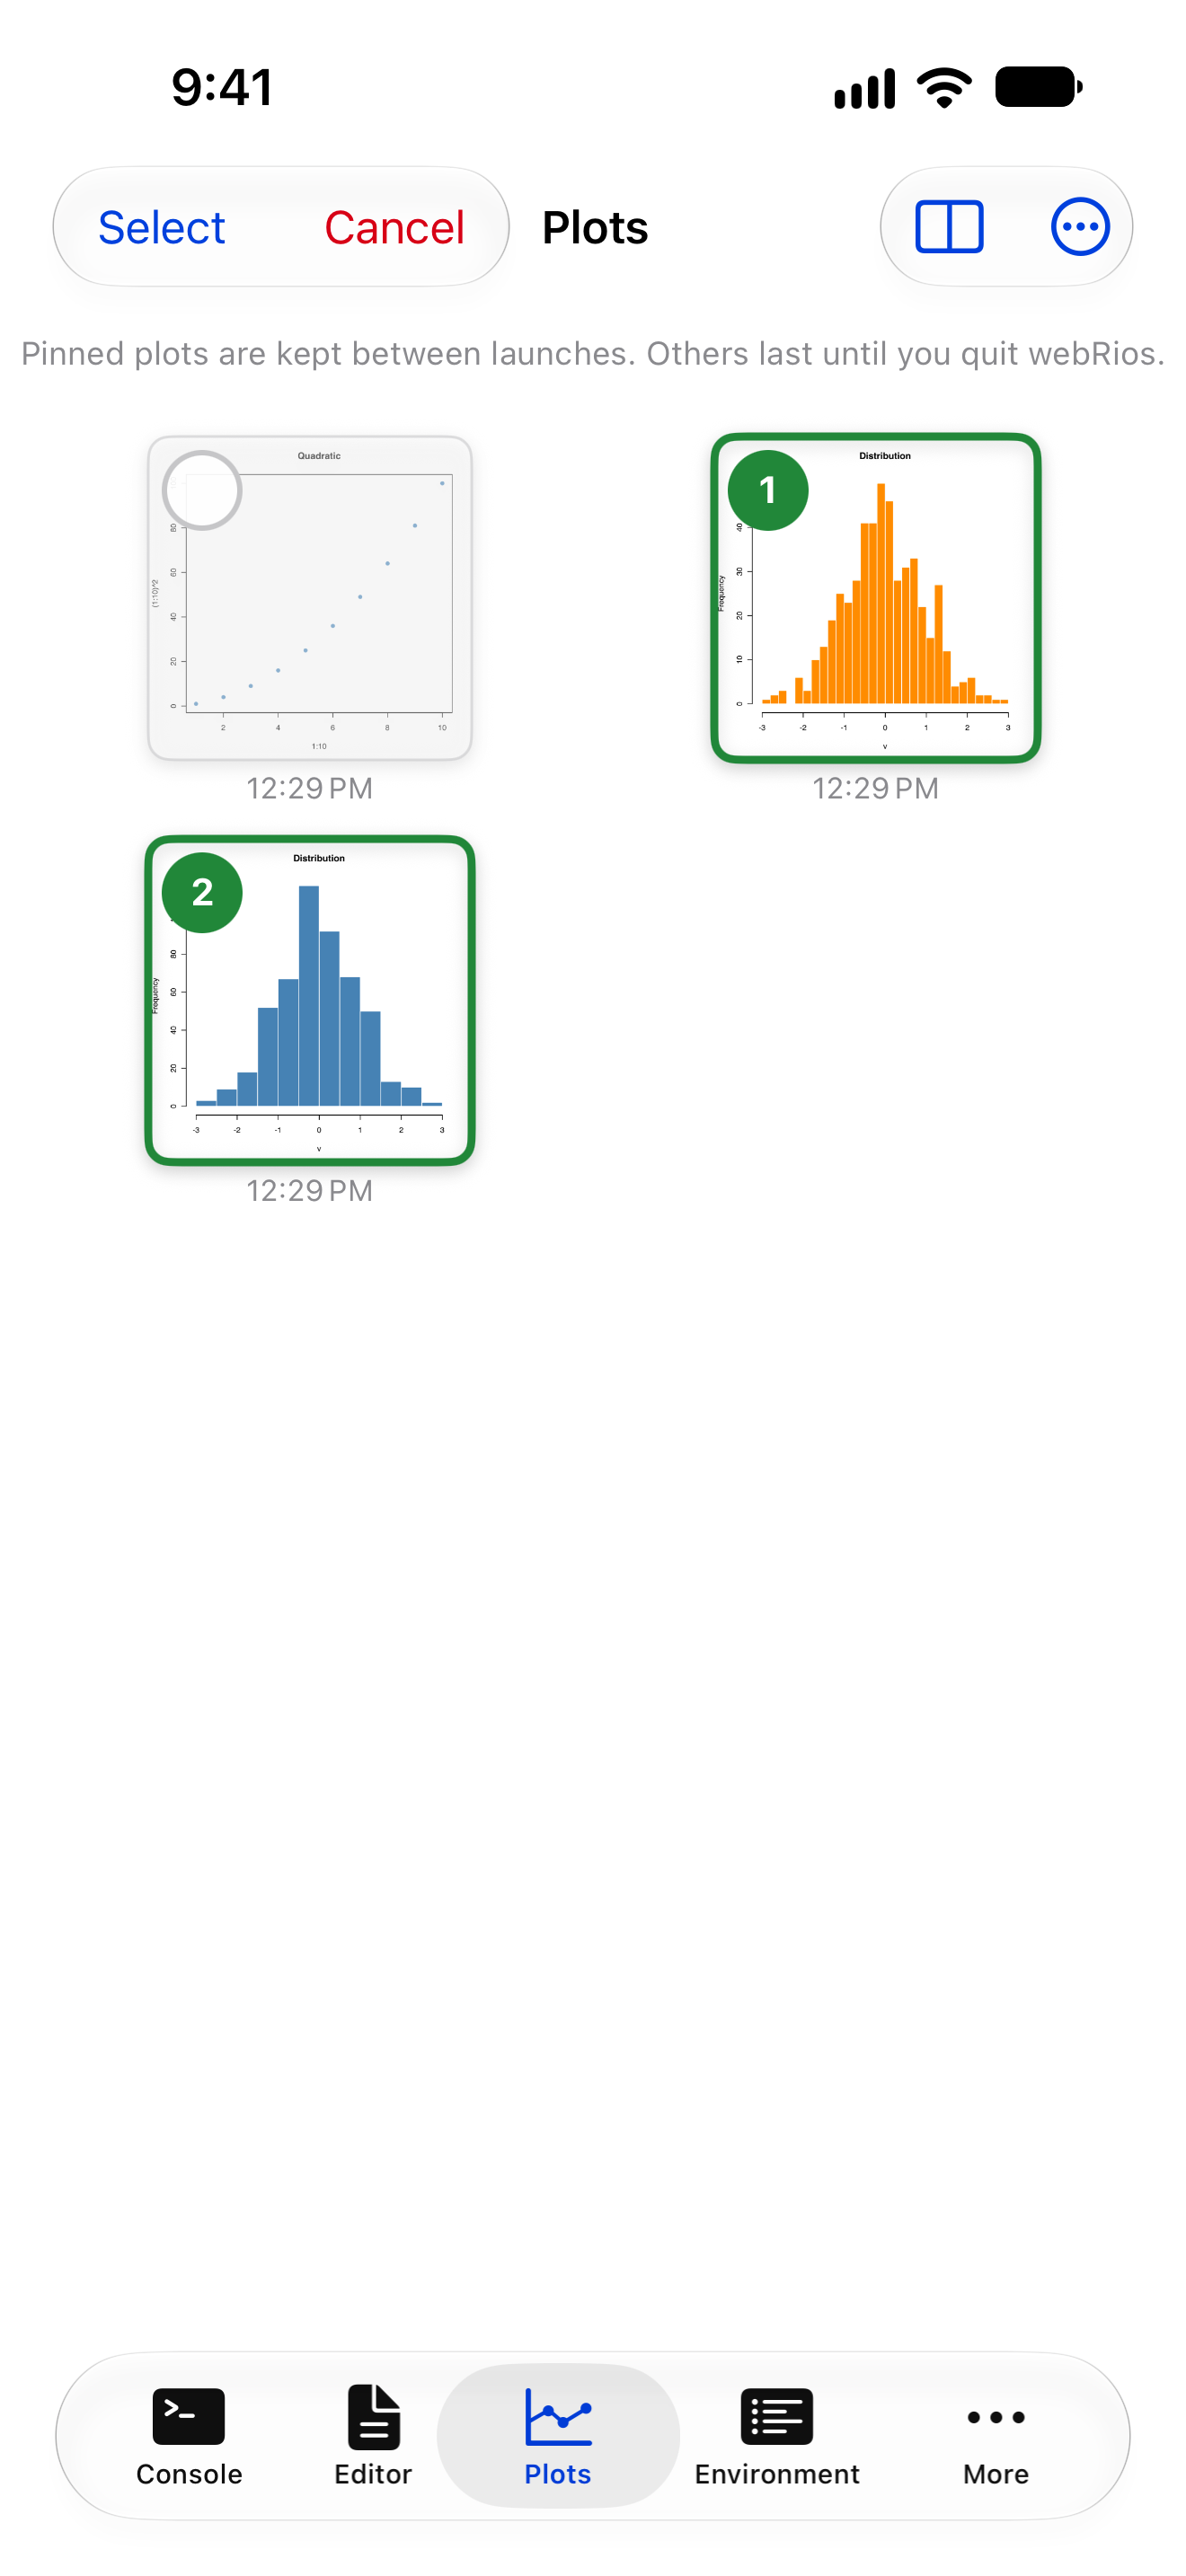
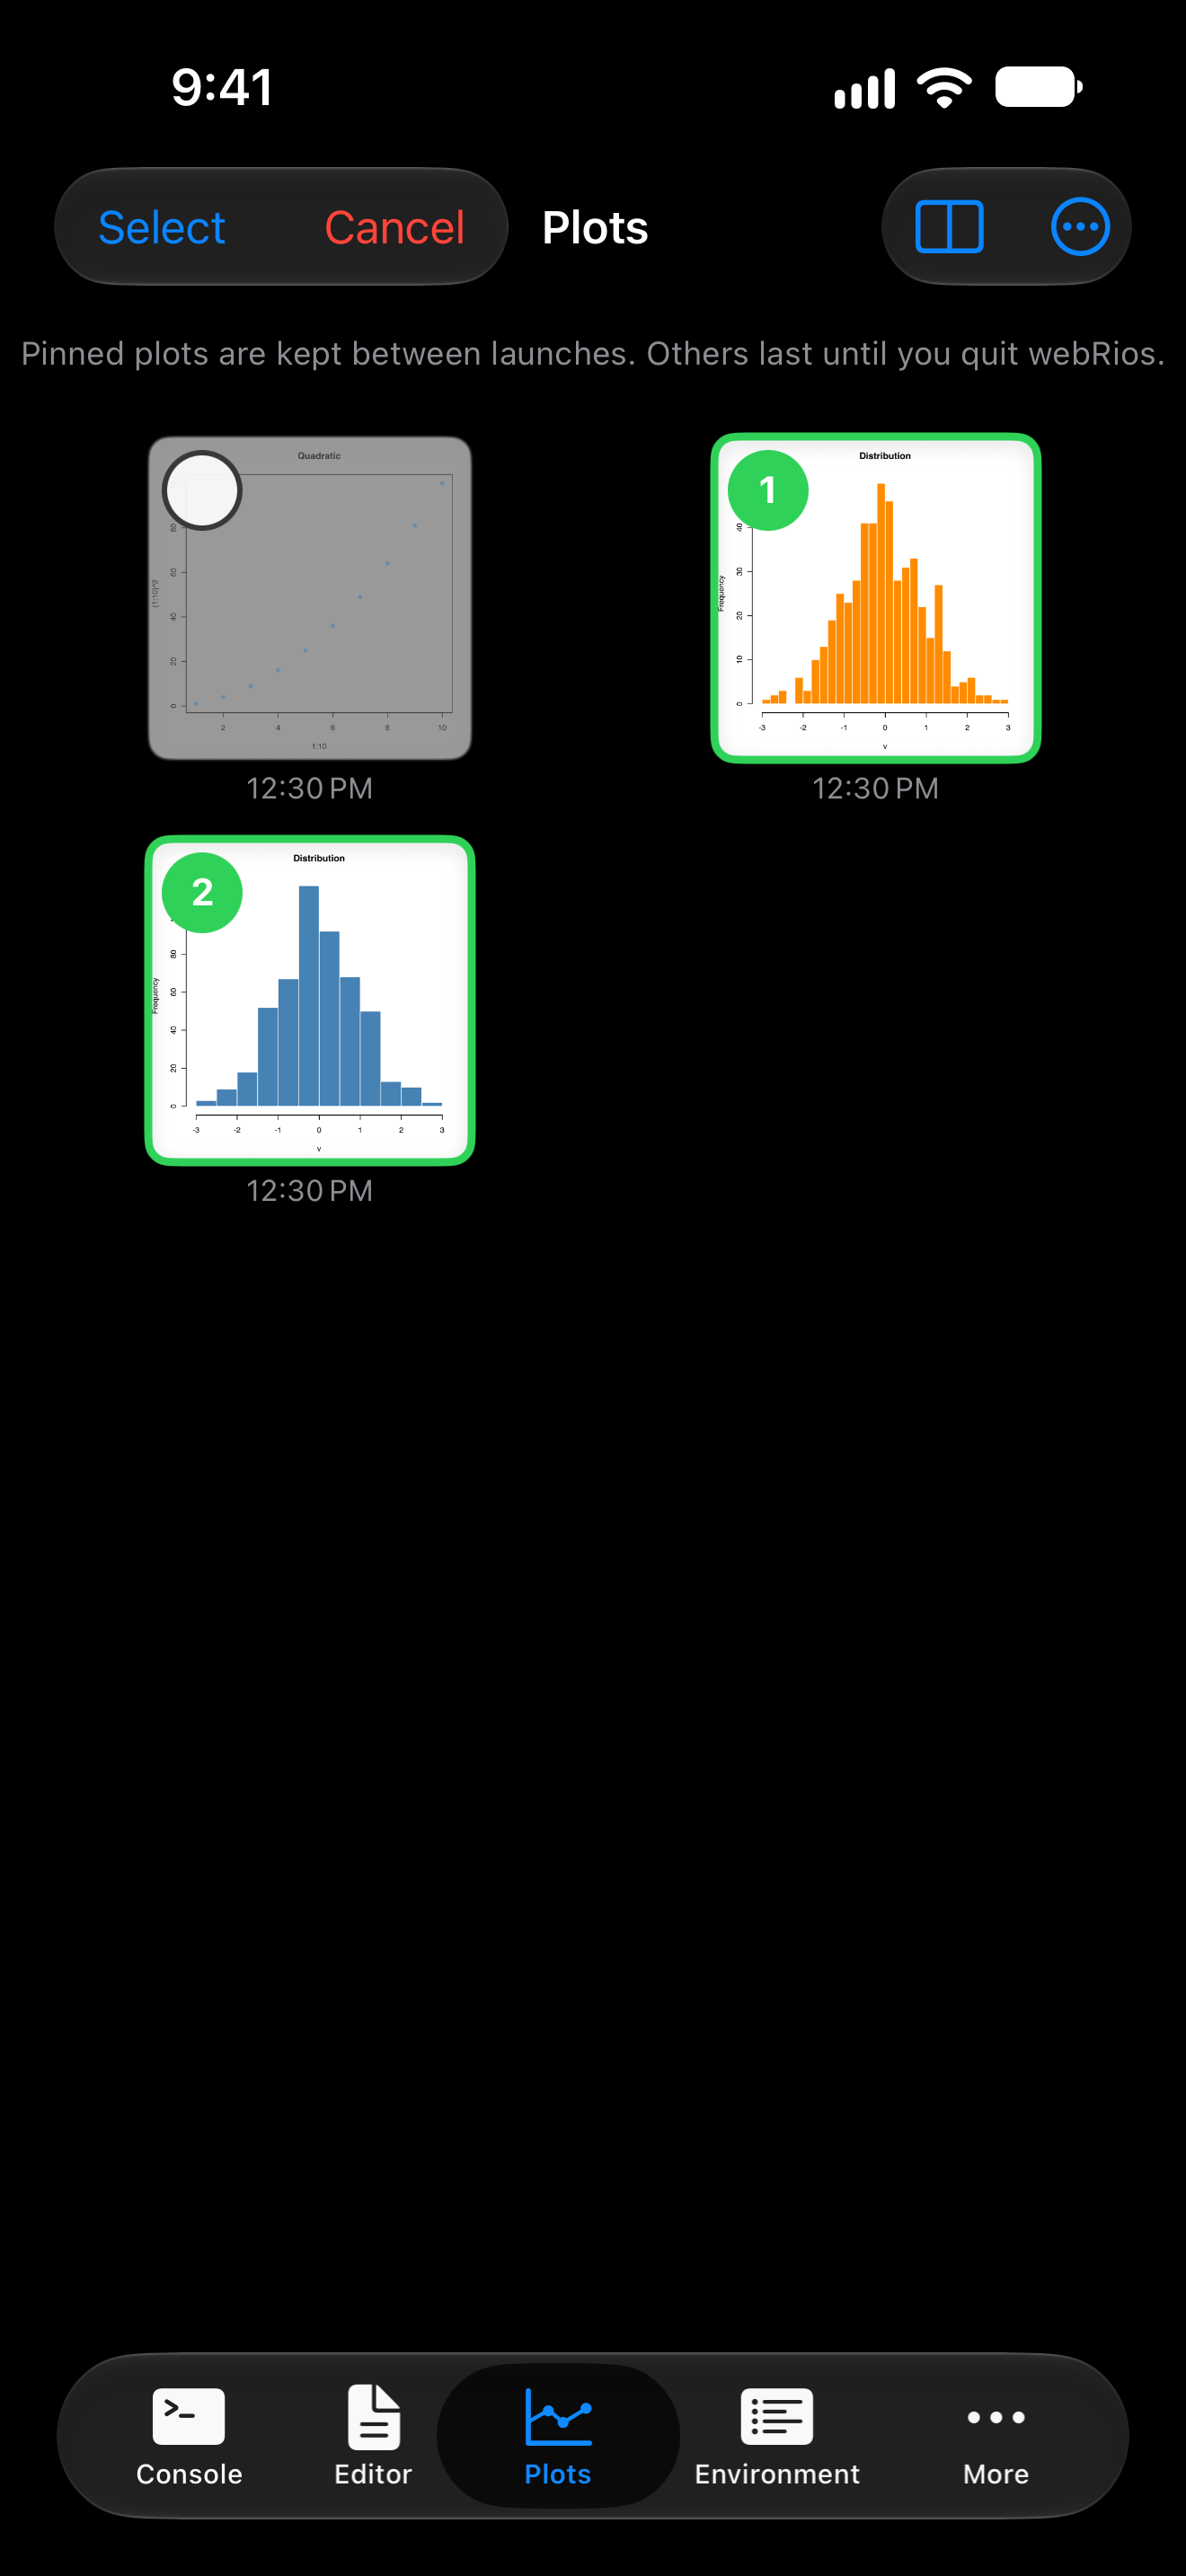
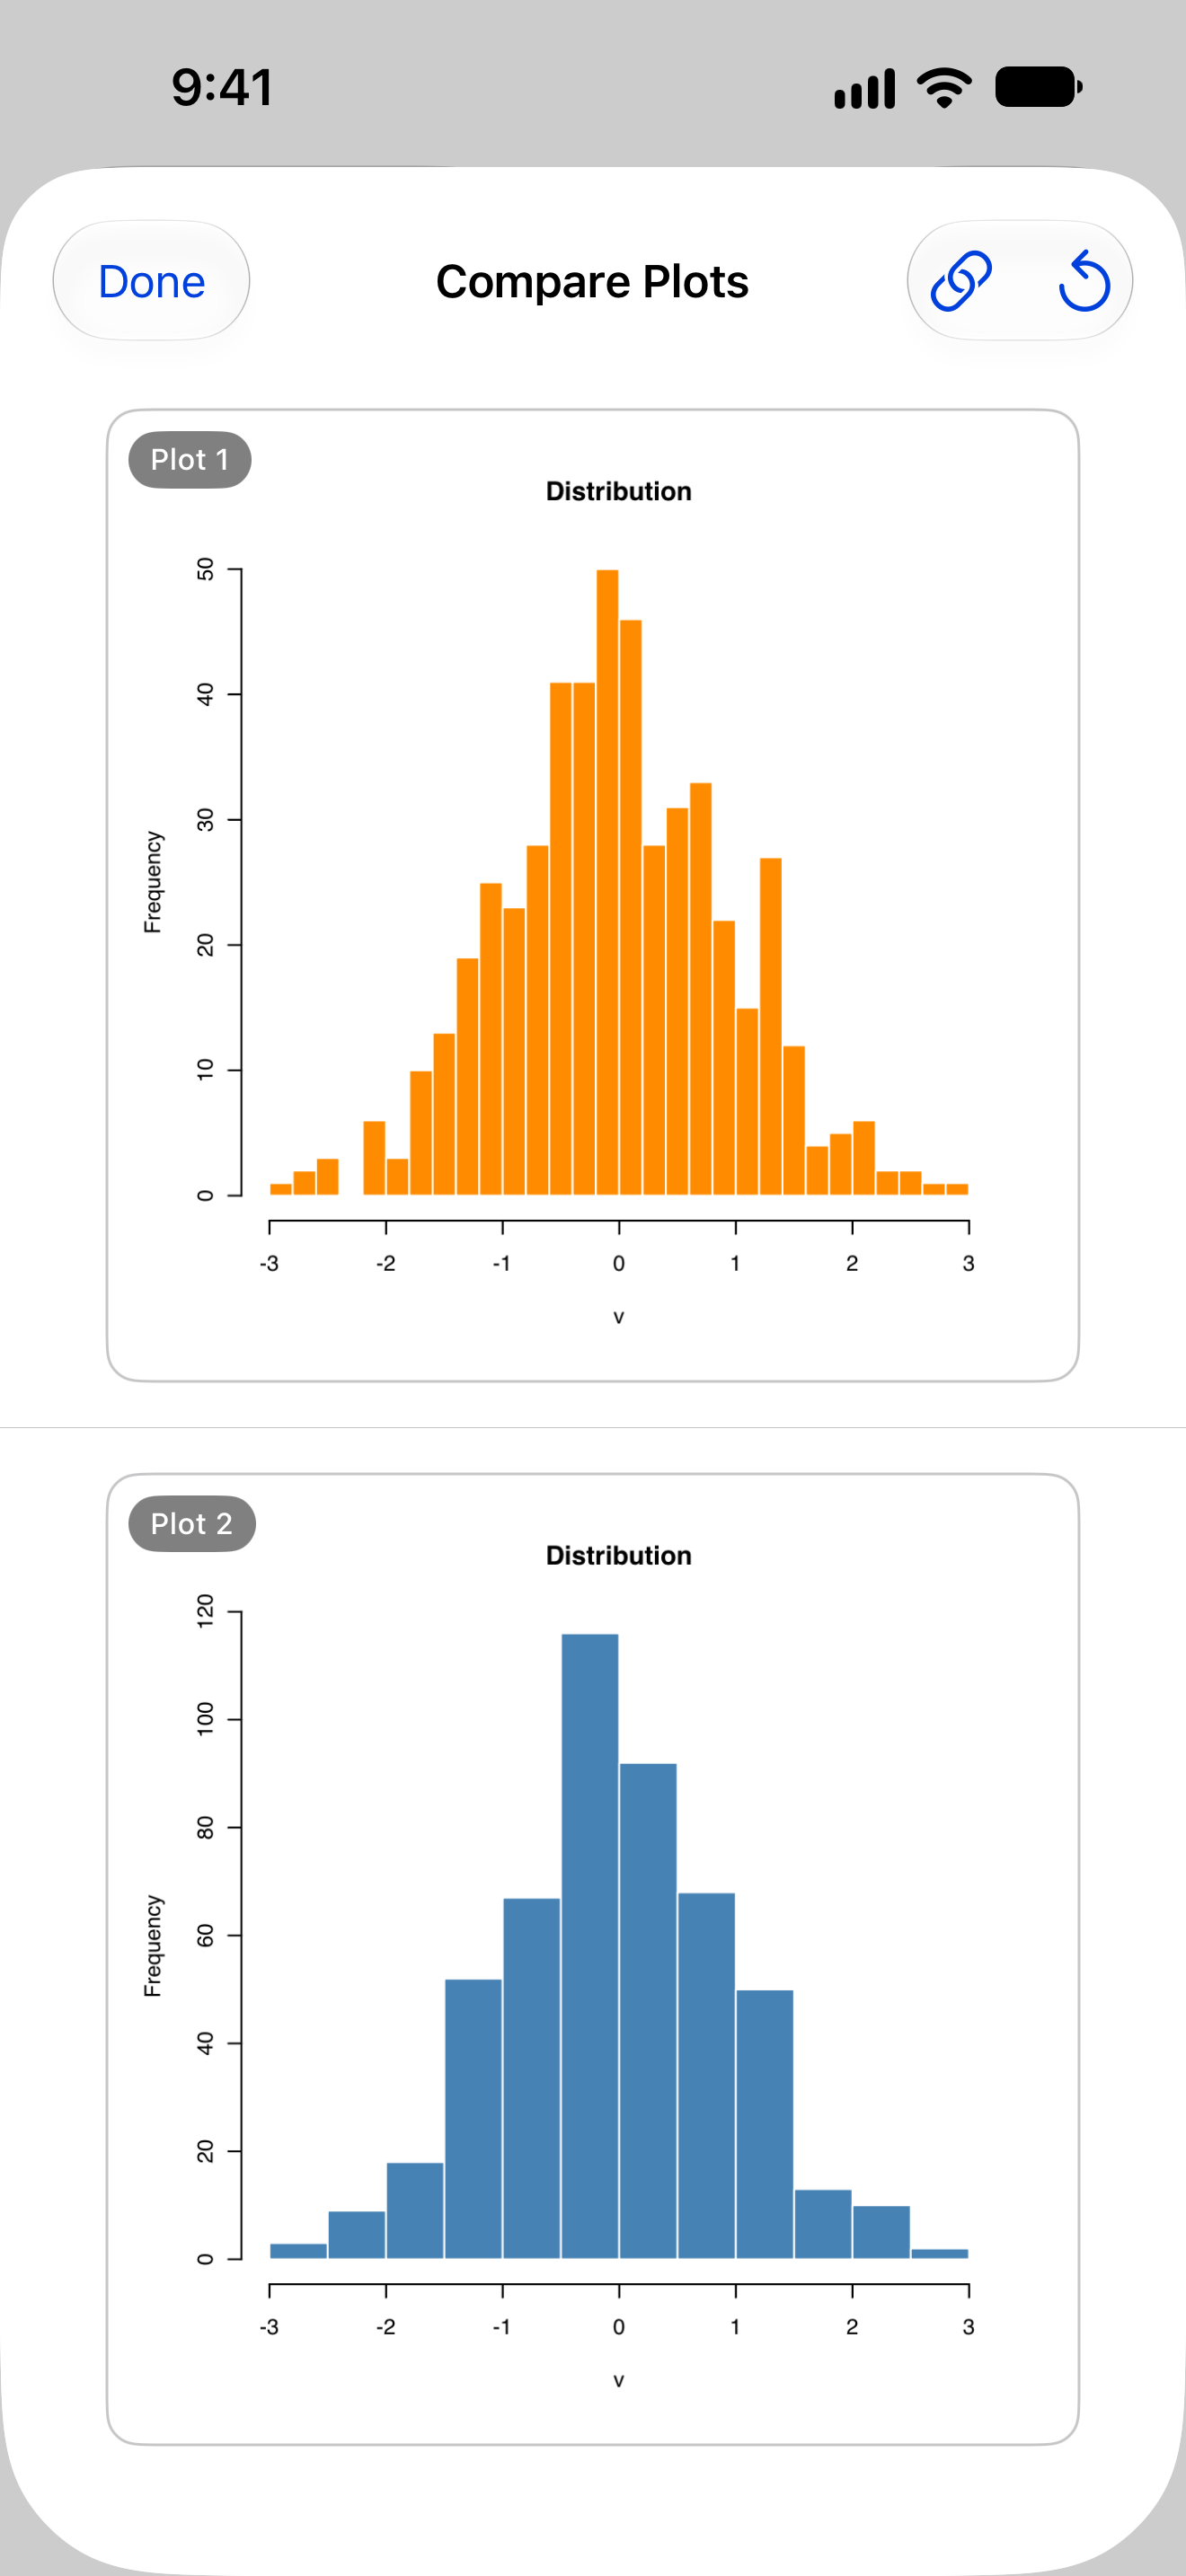
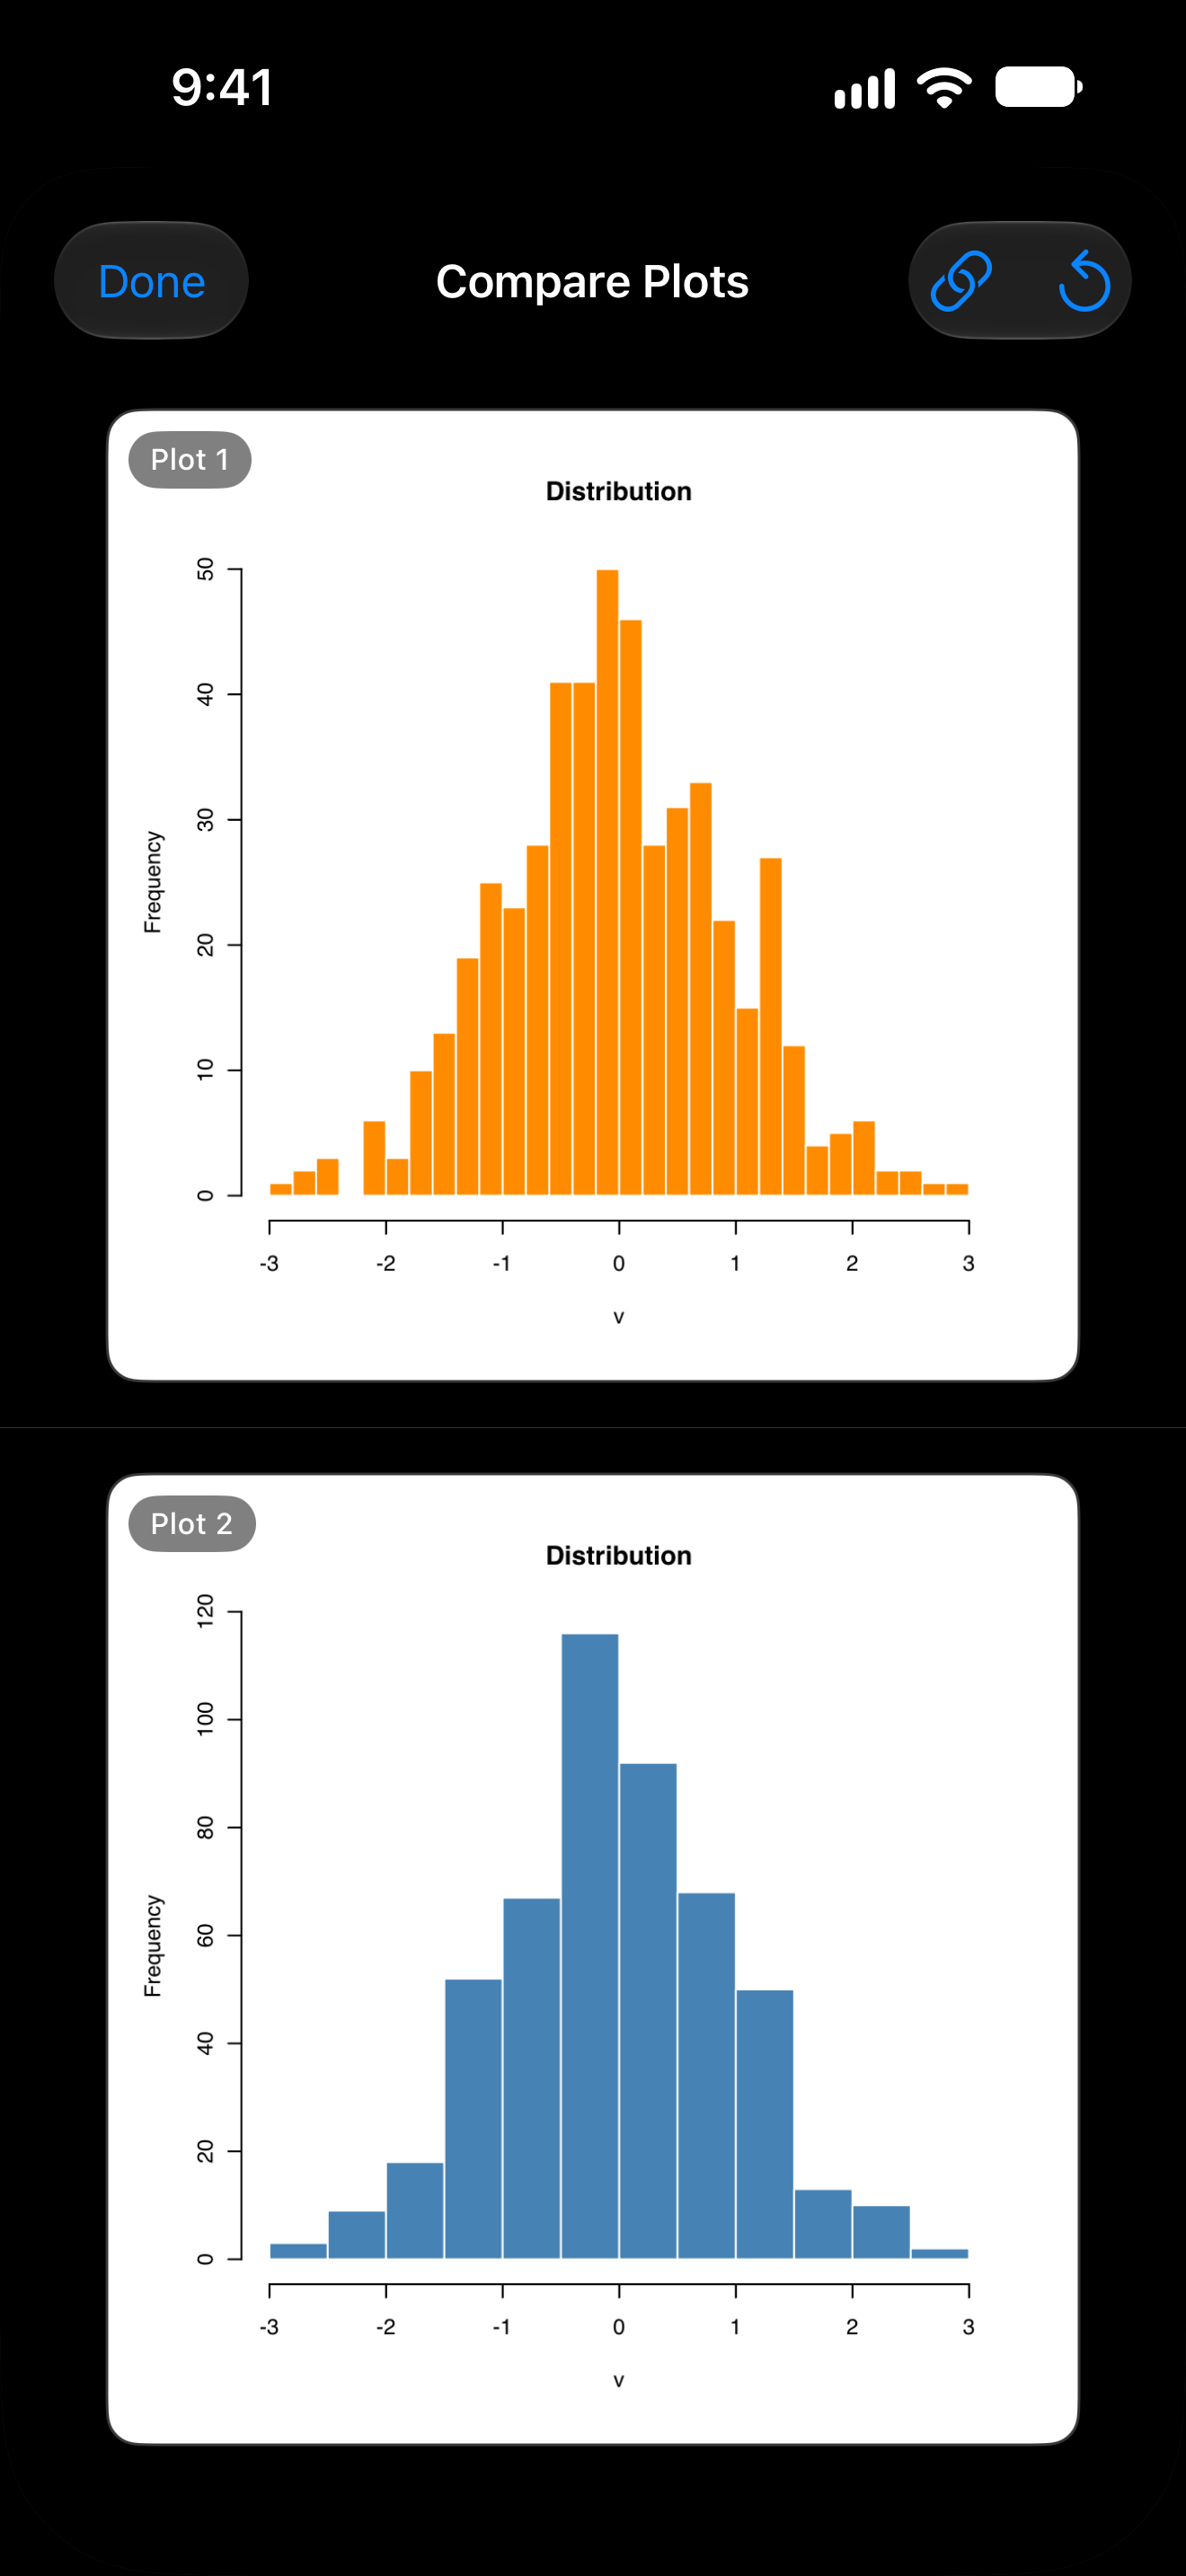
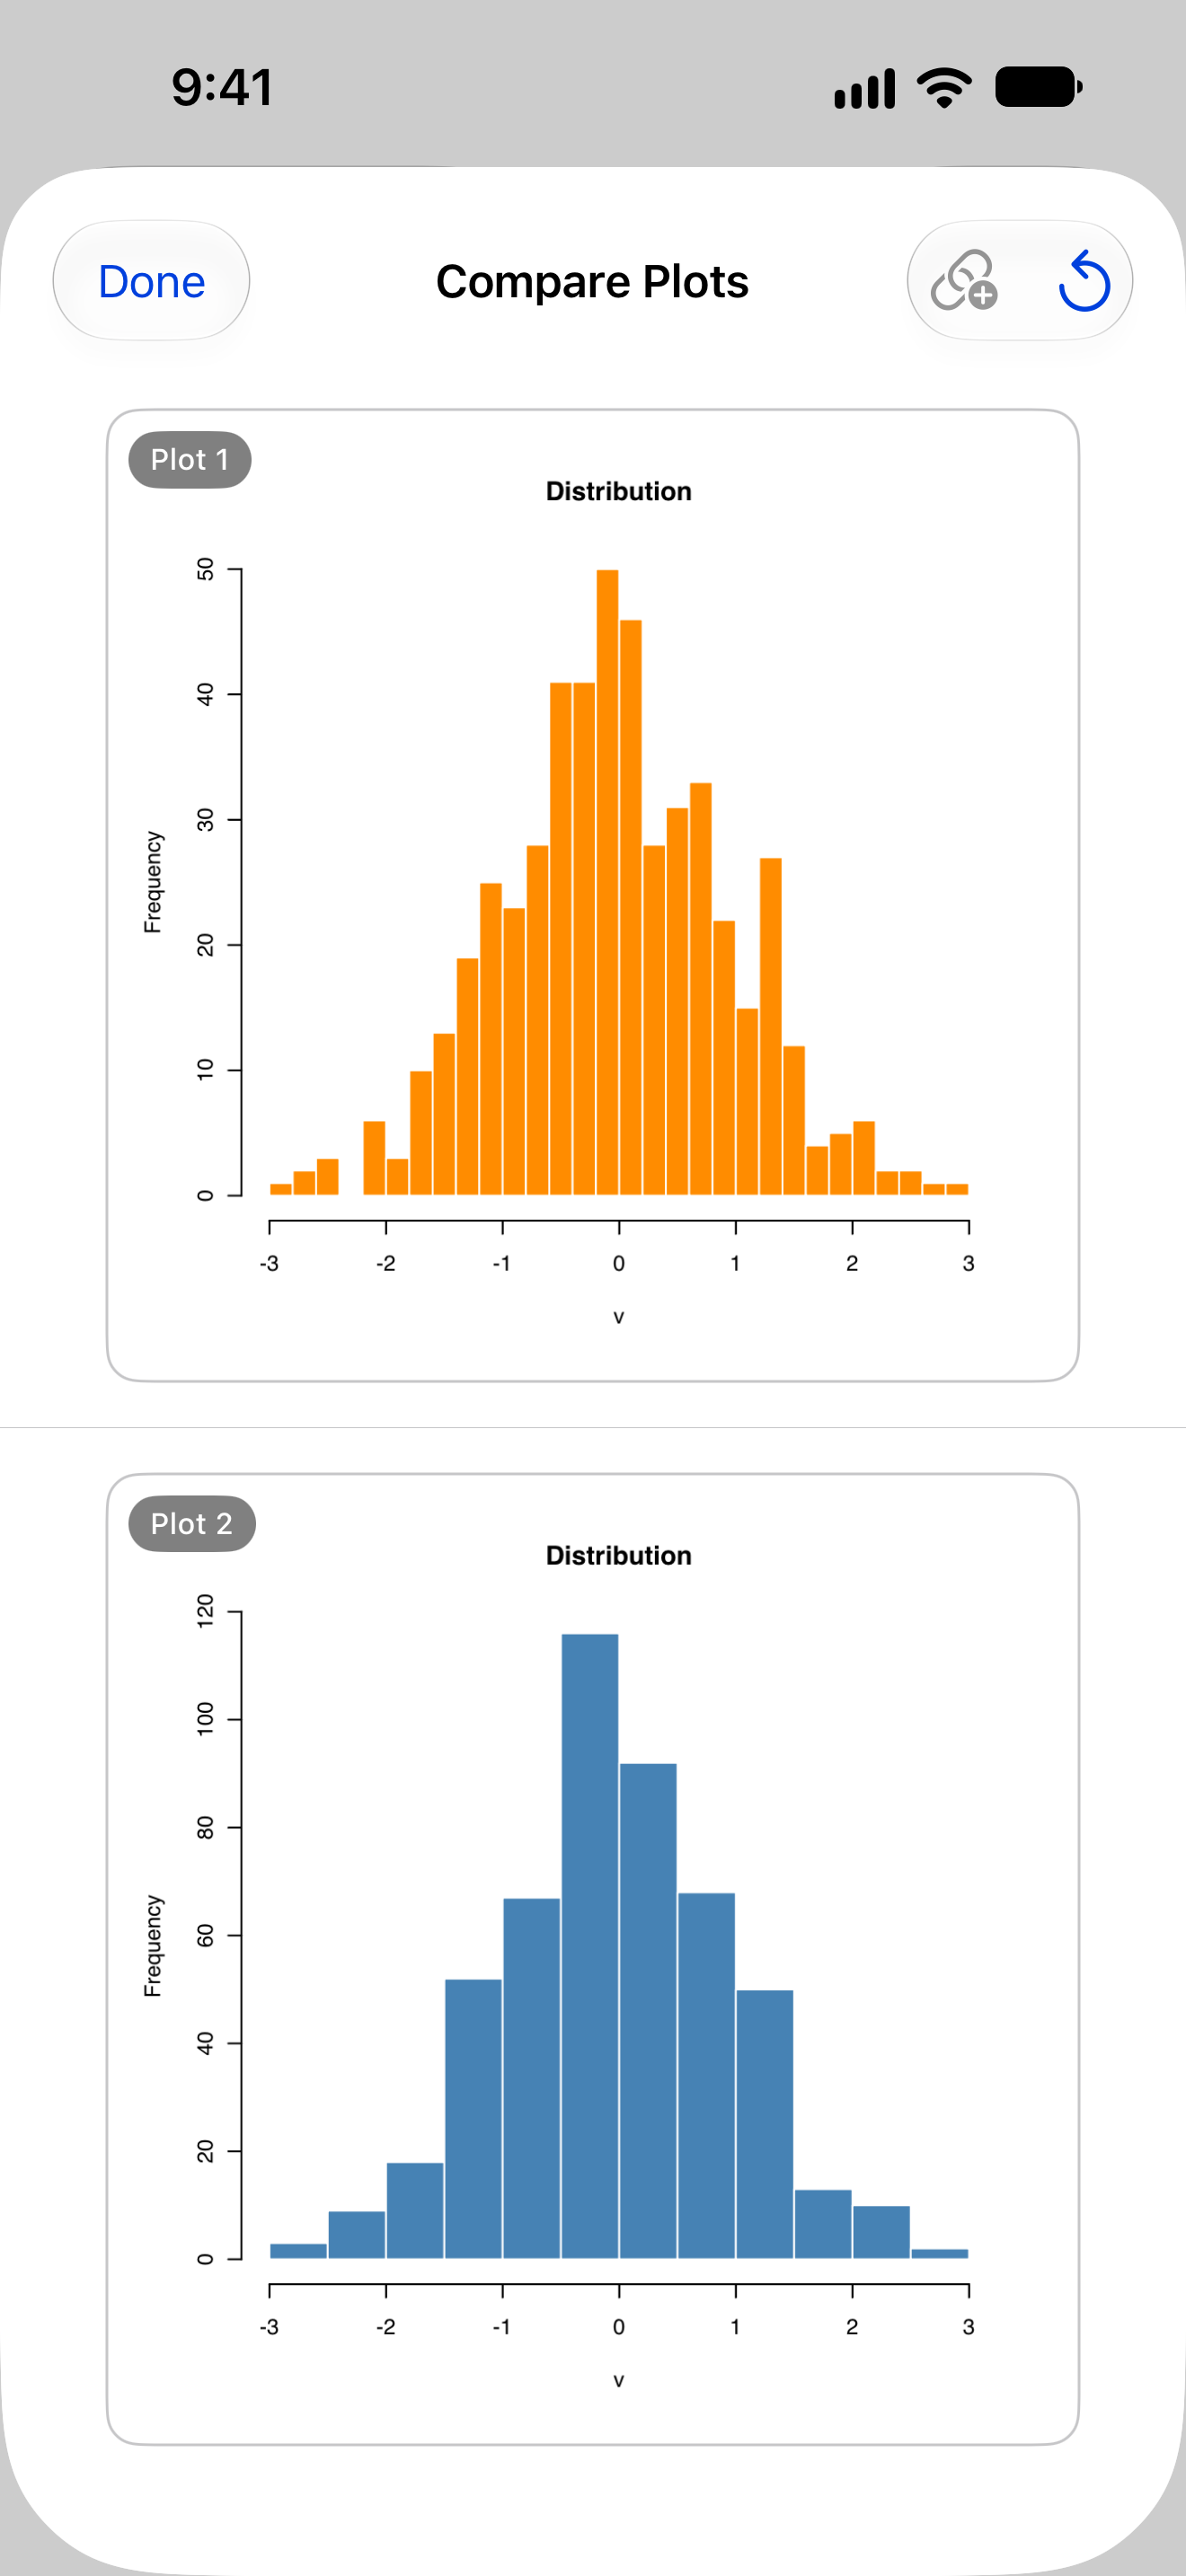
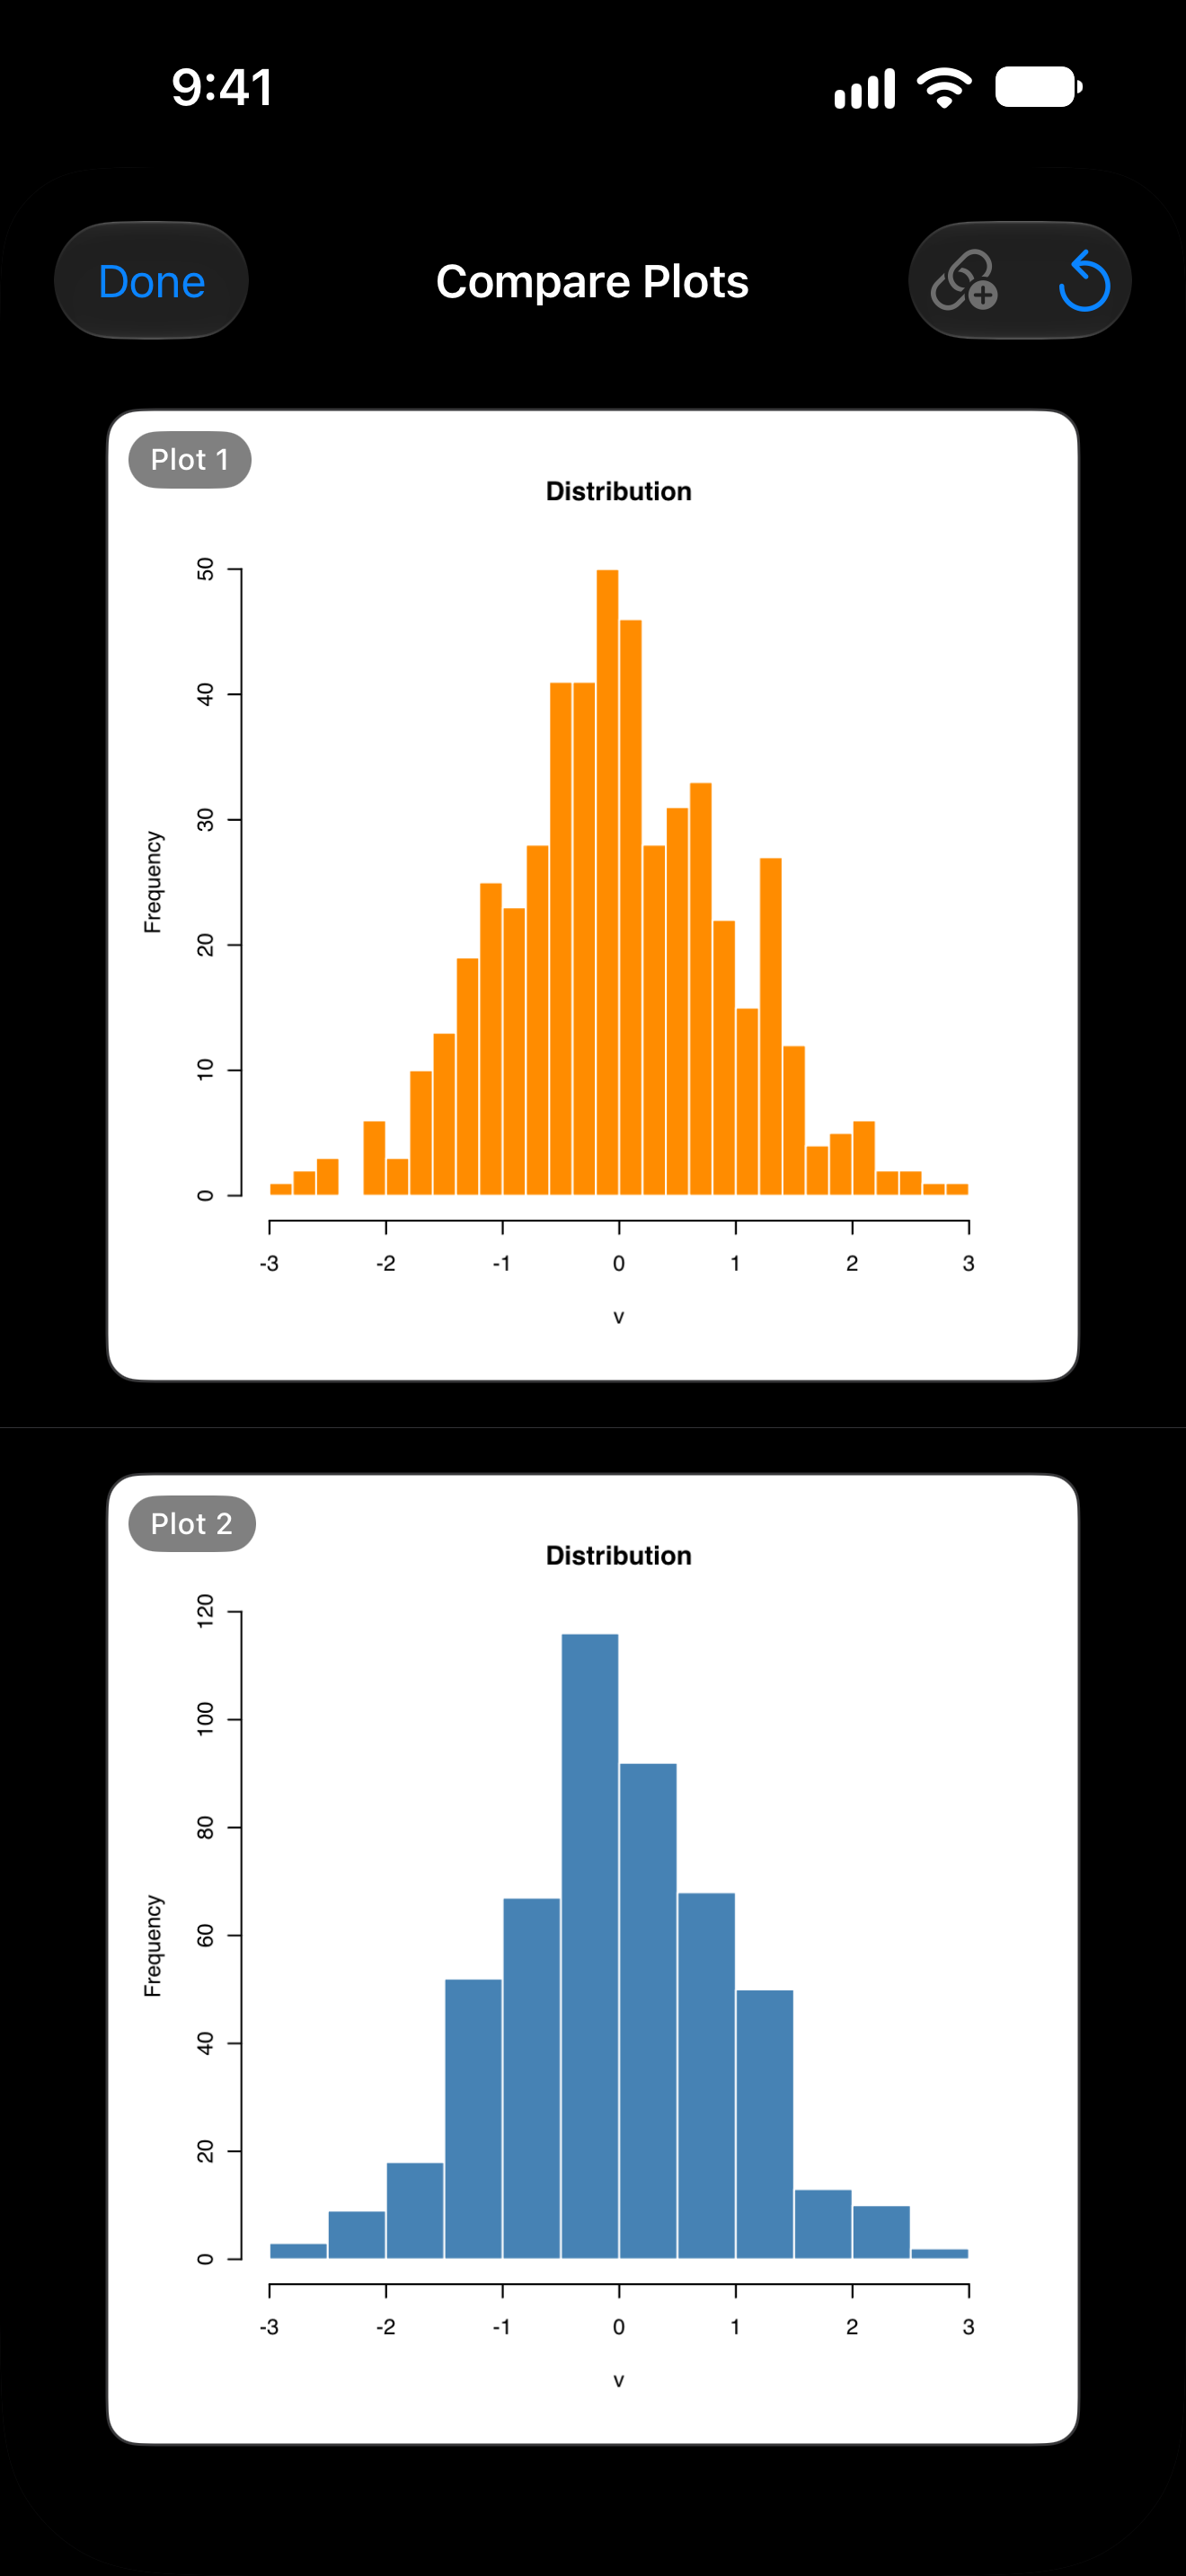
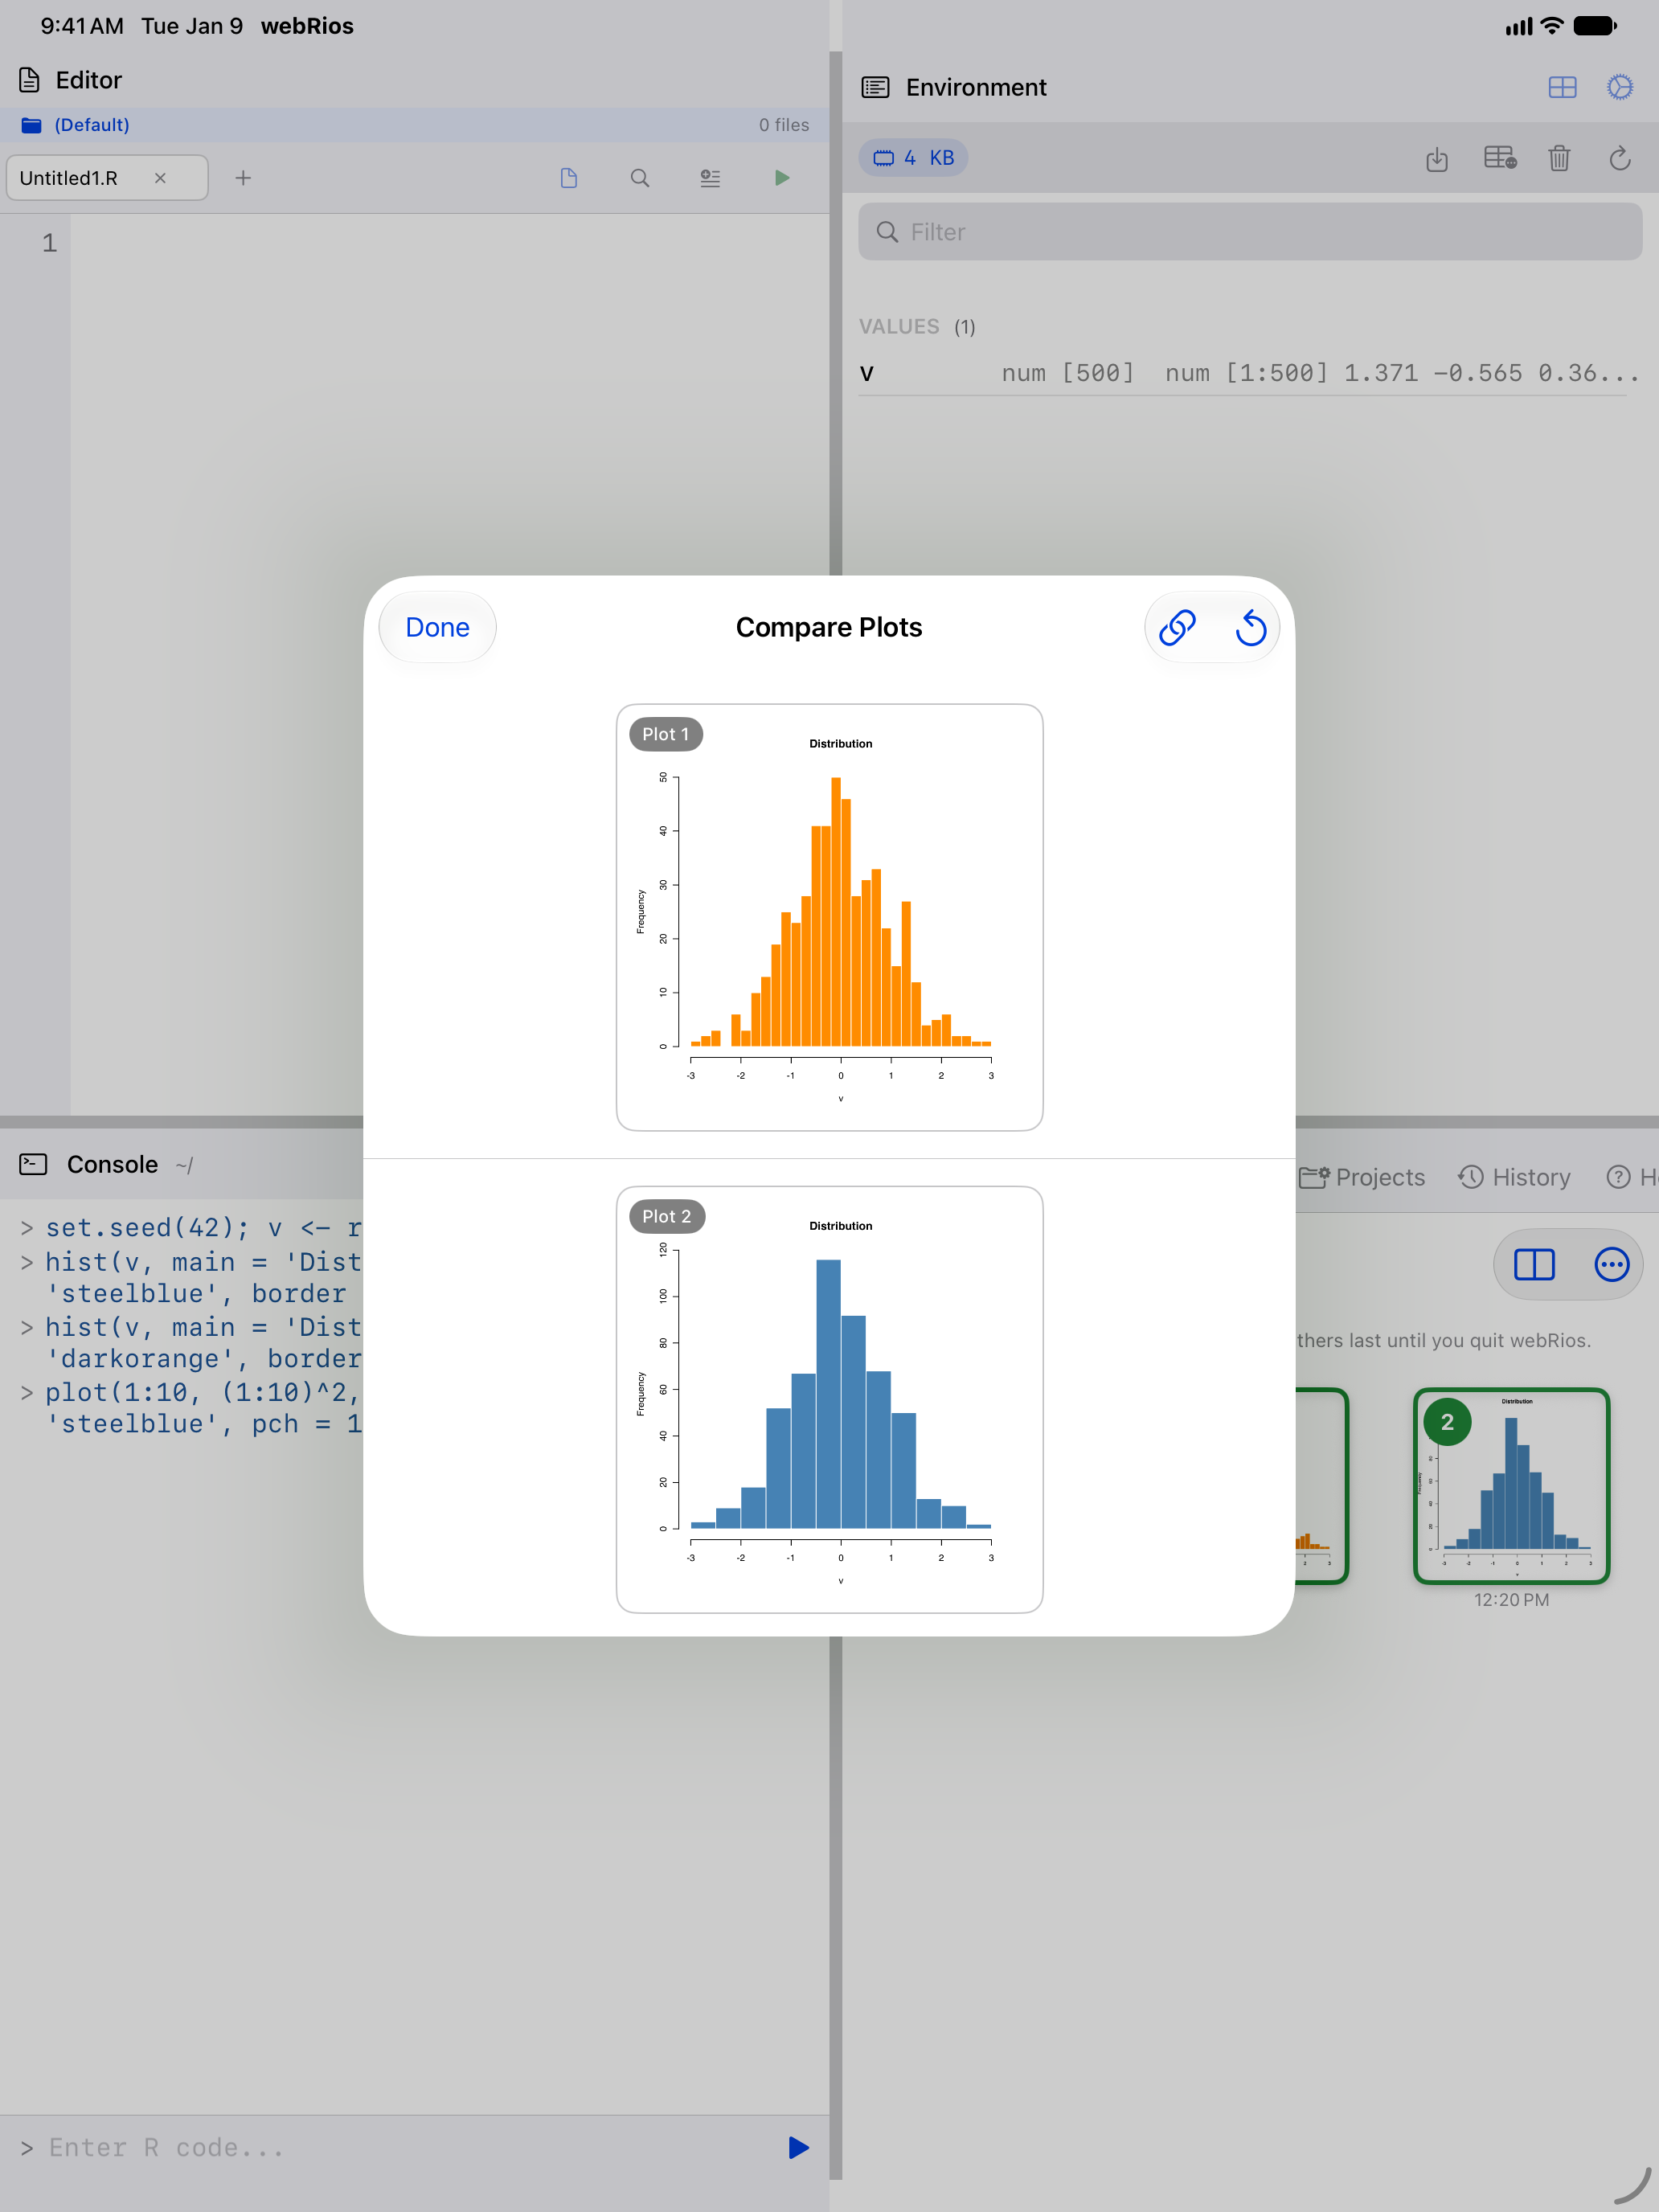
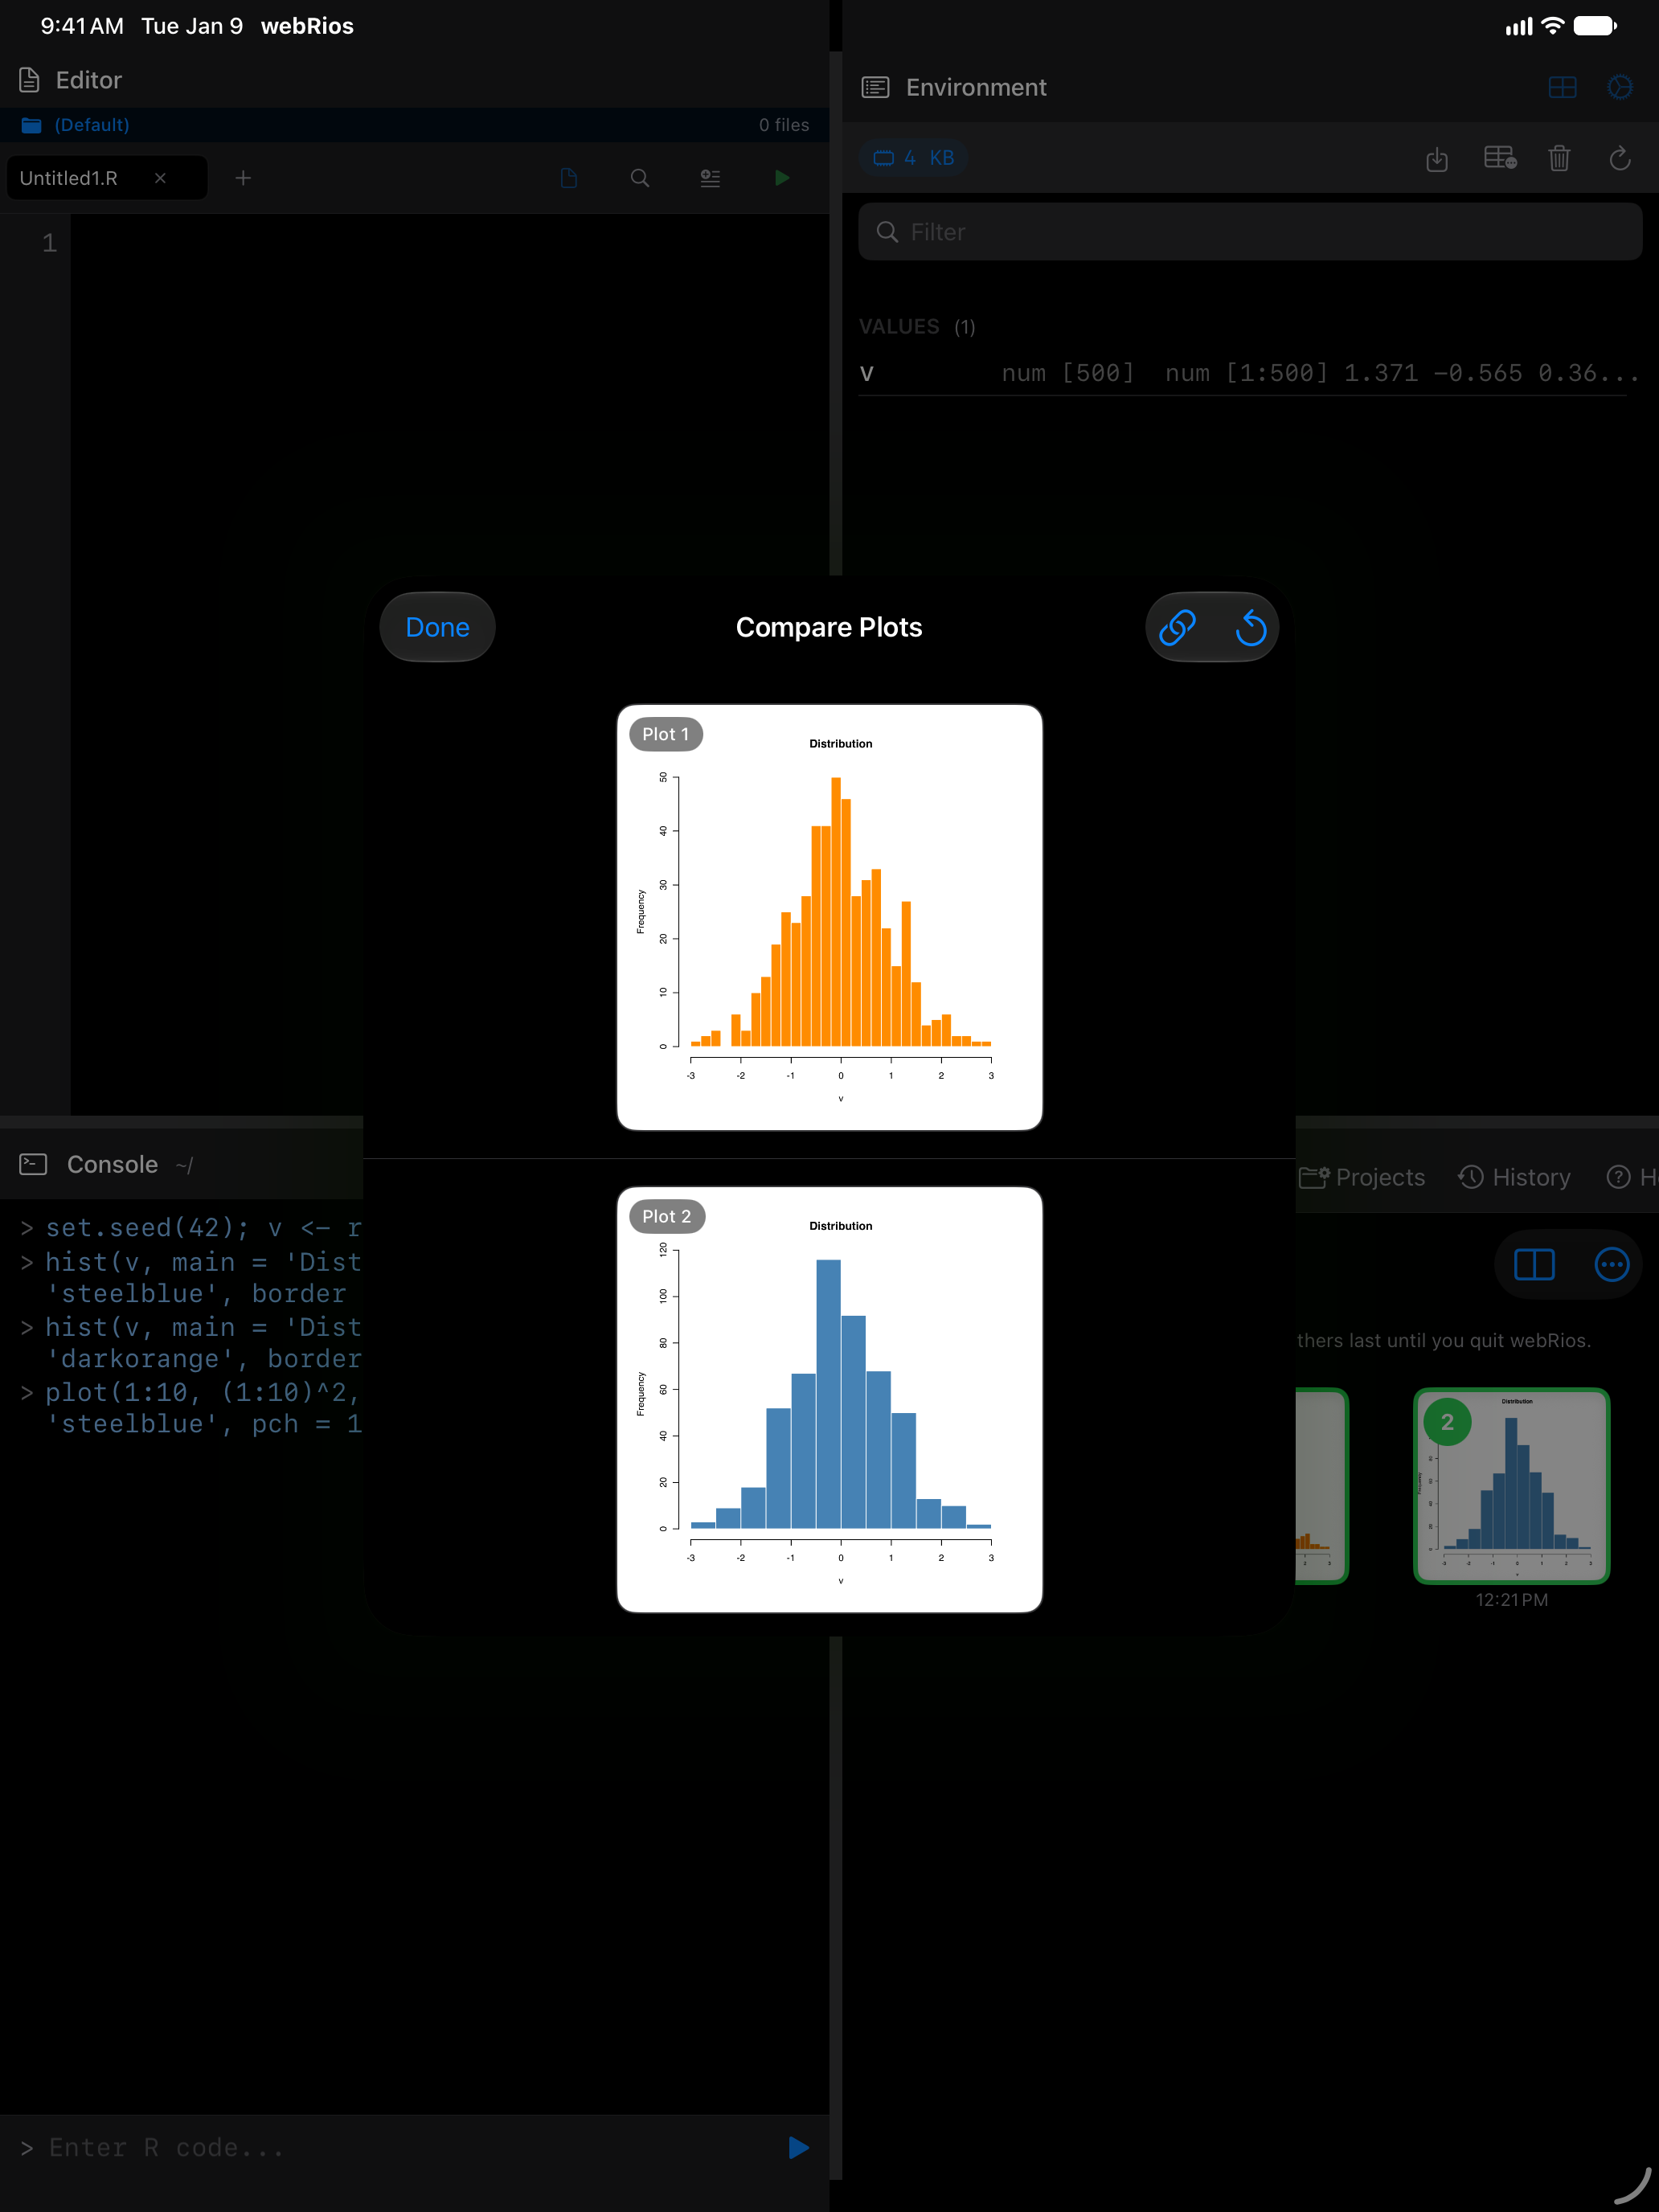
On iPad the sheet sits over your work instead of filling the screen.
Selecting and Deleting Plots
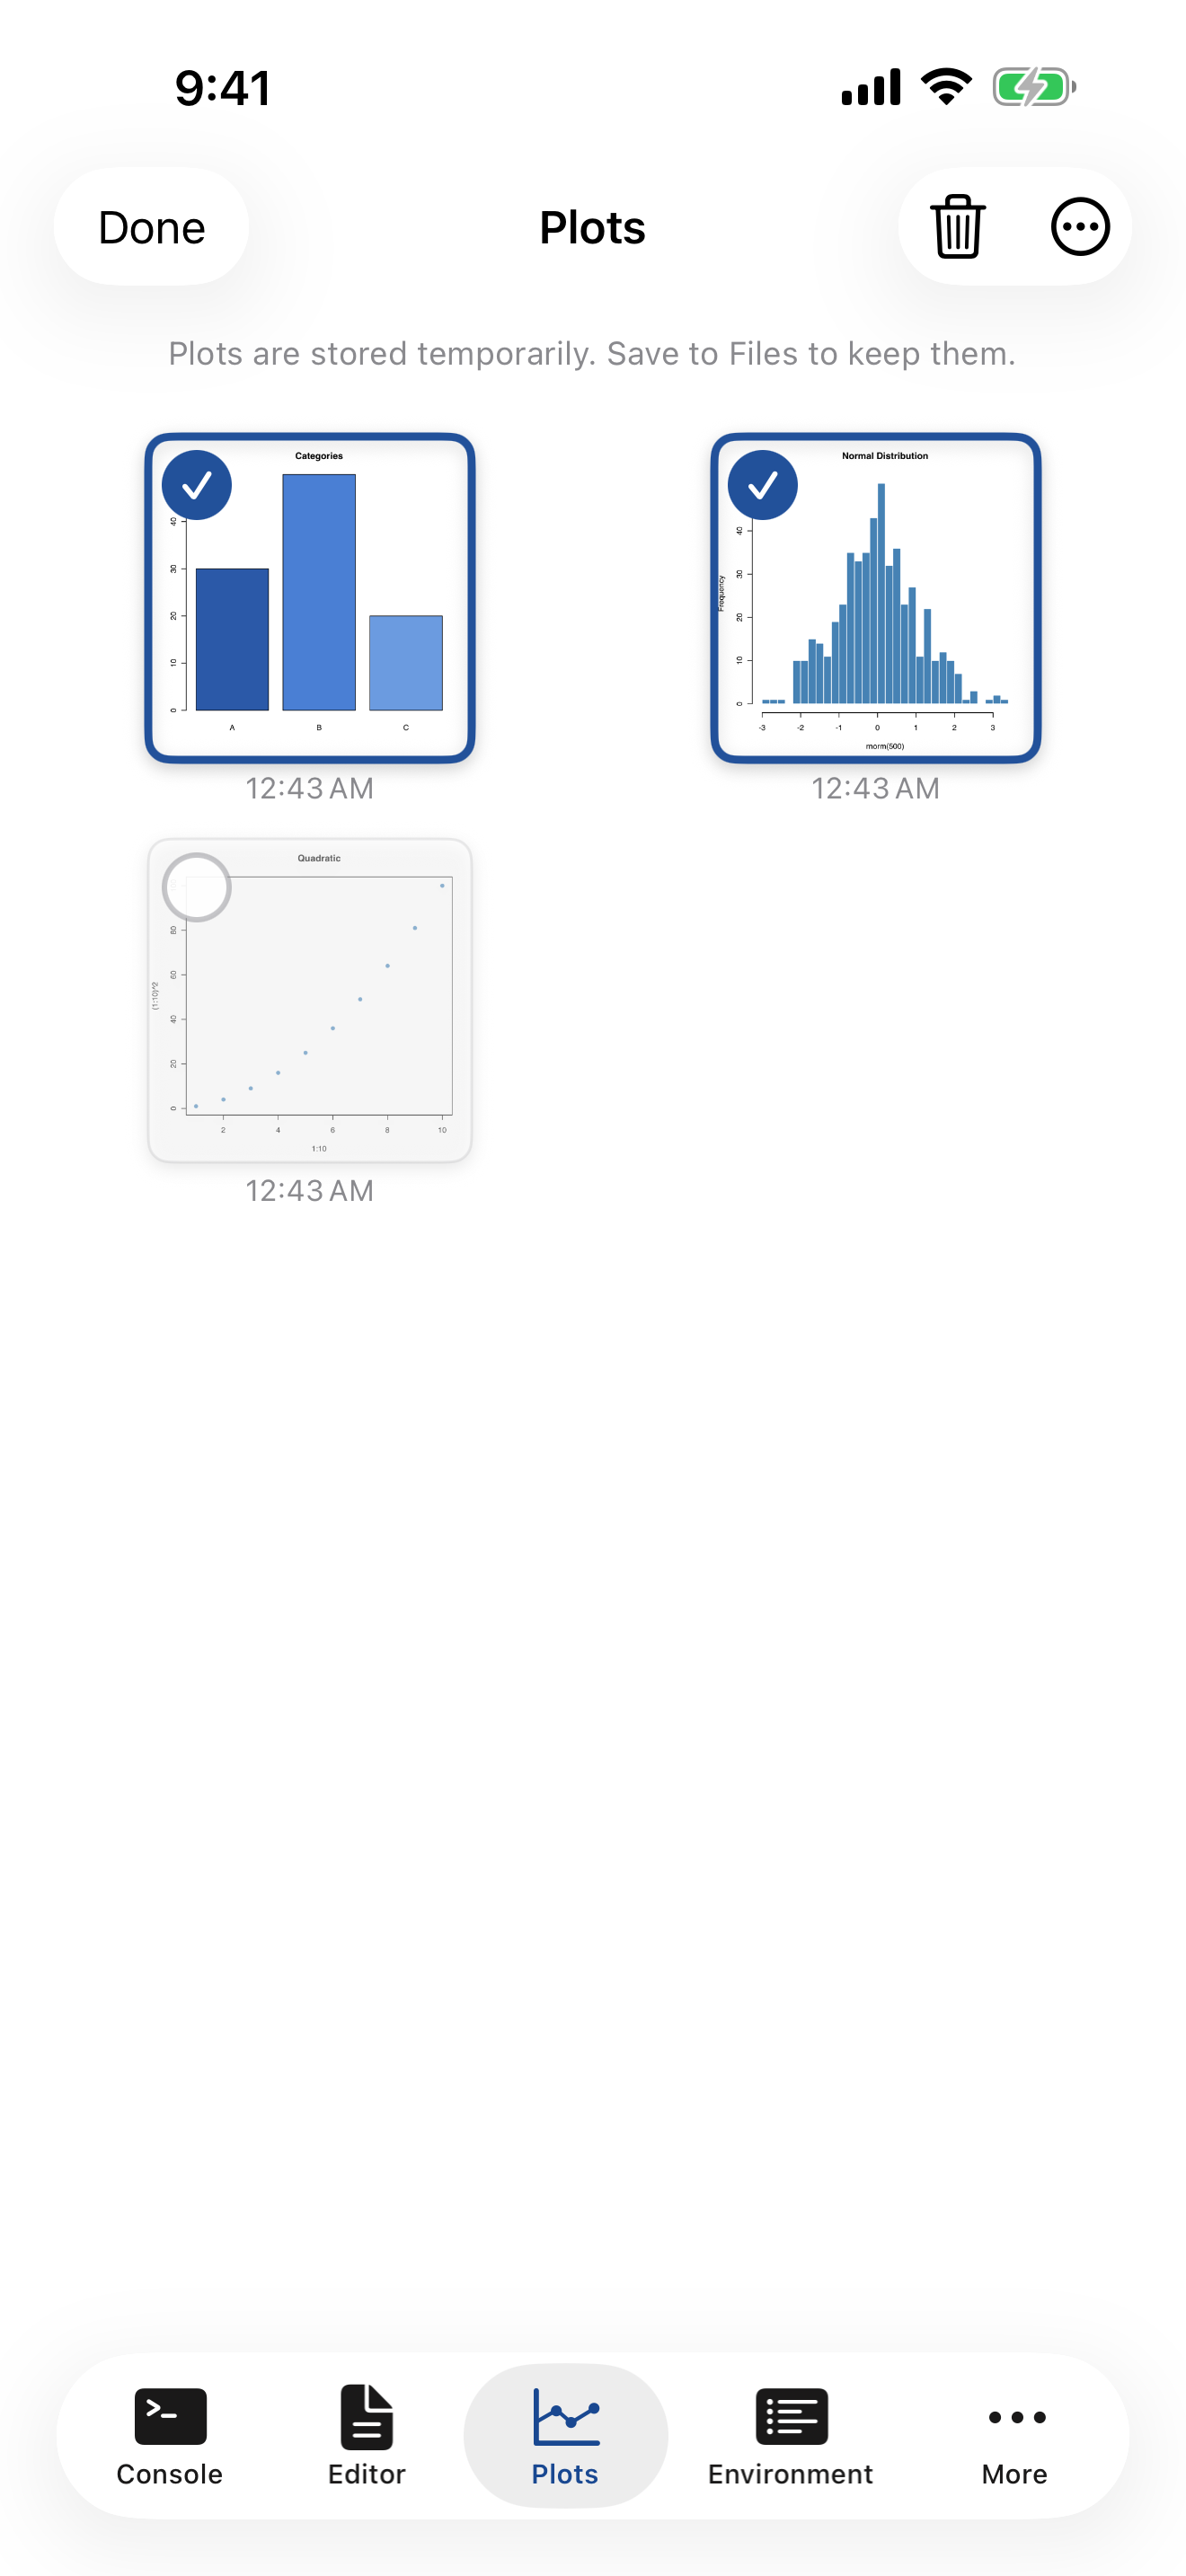
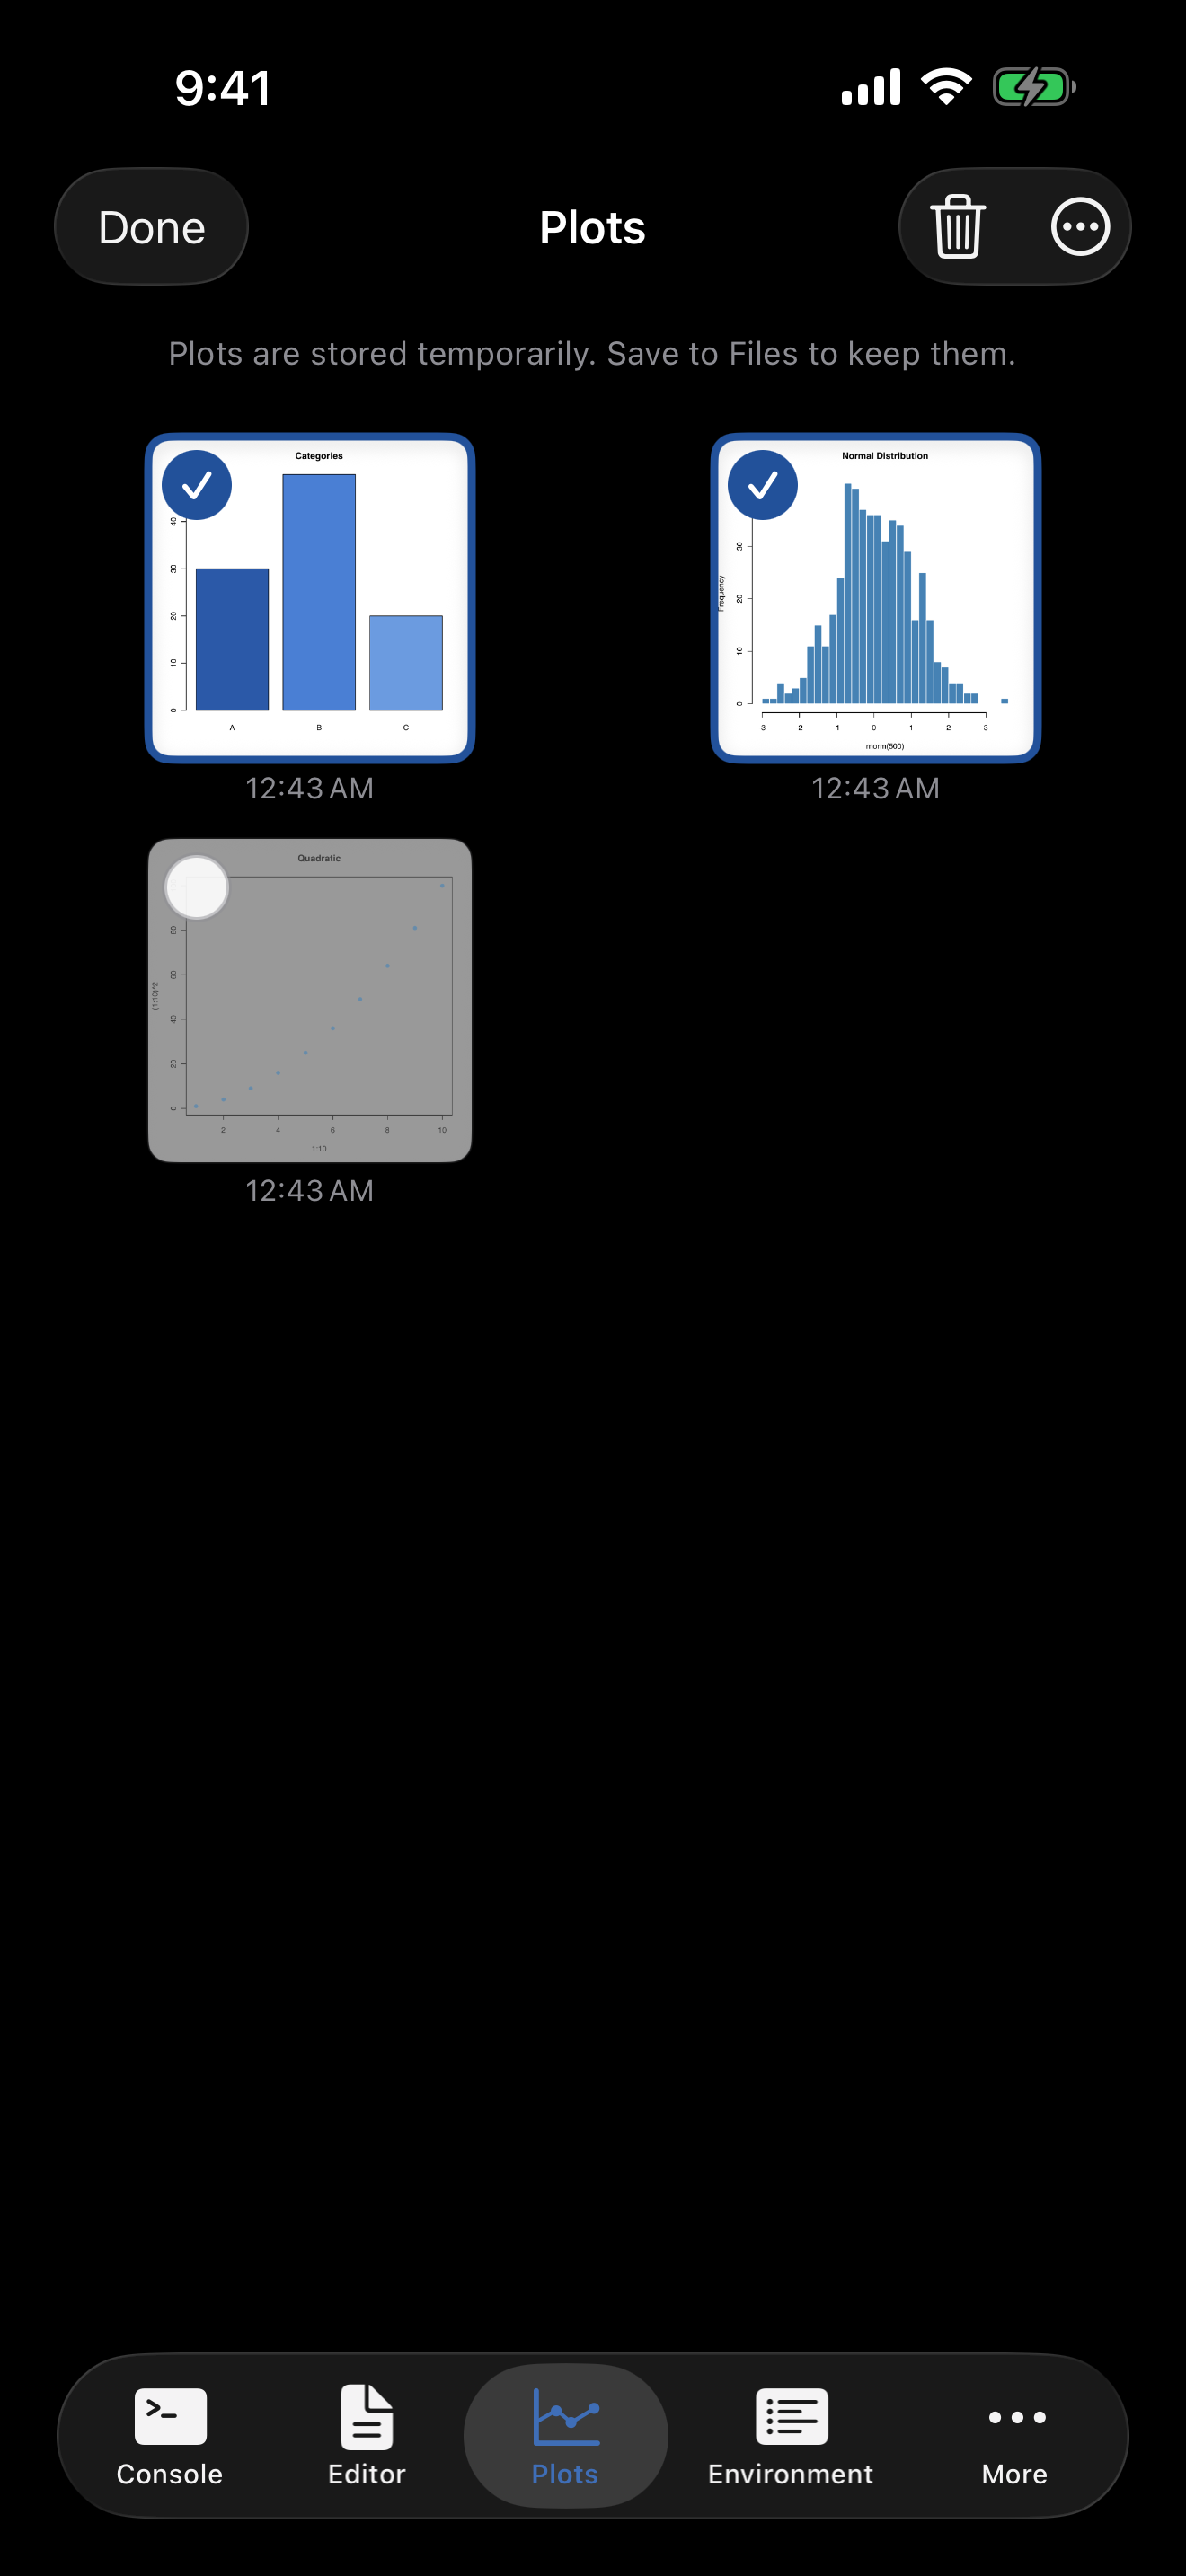
Tap Select in the toolbar to enter selection mode. Tap plots to select them, then Delete to remove them in batch.
You can also delete a single plot via long-press or from the detail view’s trash icon.
Clear All Plots in the … menu asks first, says how many will go, and keeps pinned plots. It is hidden when every plot is pinned. Select mode’s Delete also counts only unpinned plots.
Pinning Plots
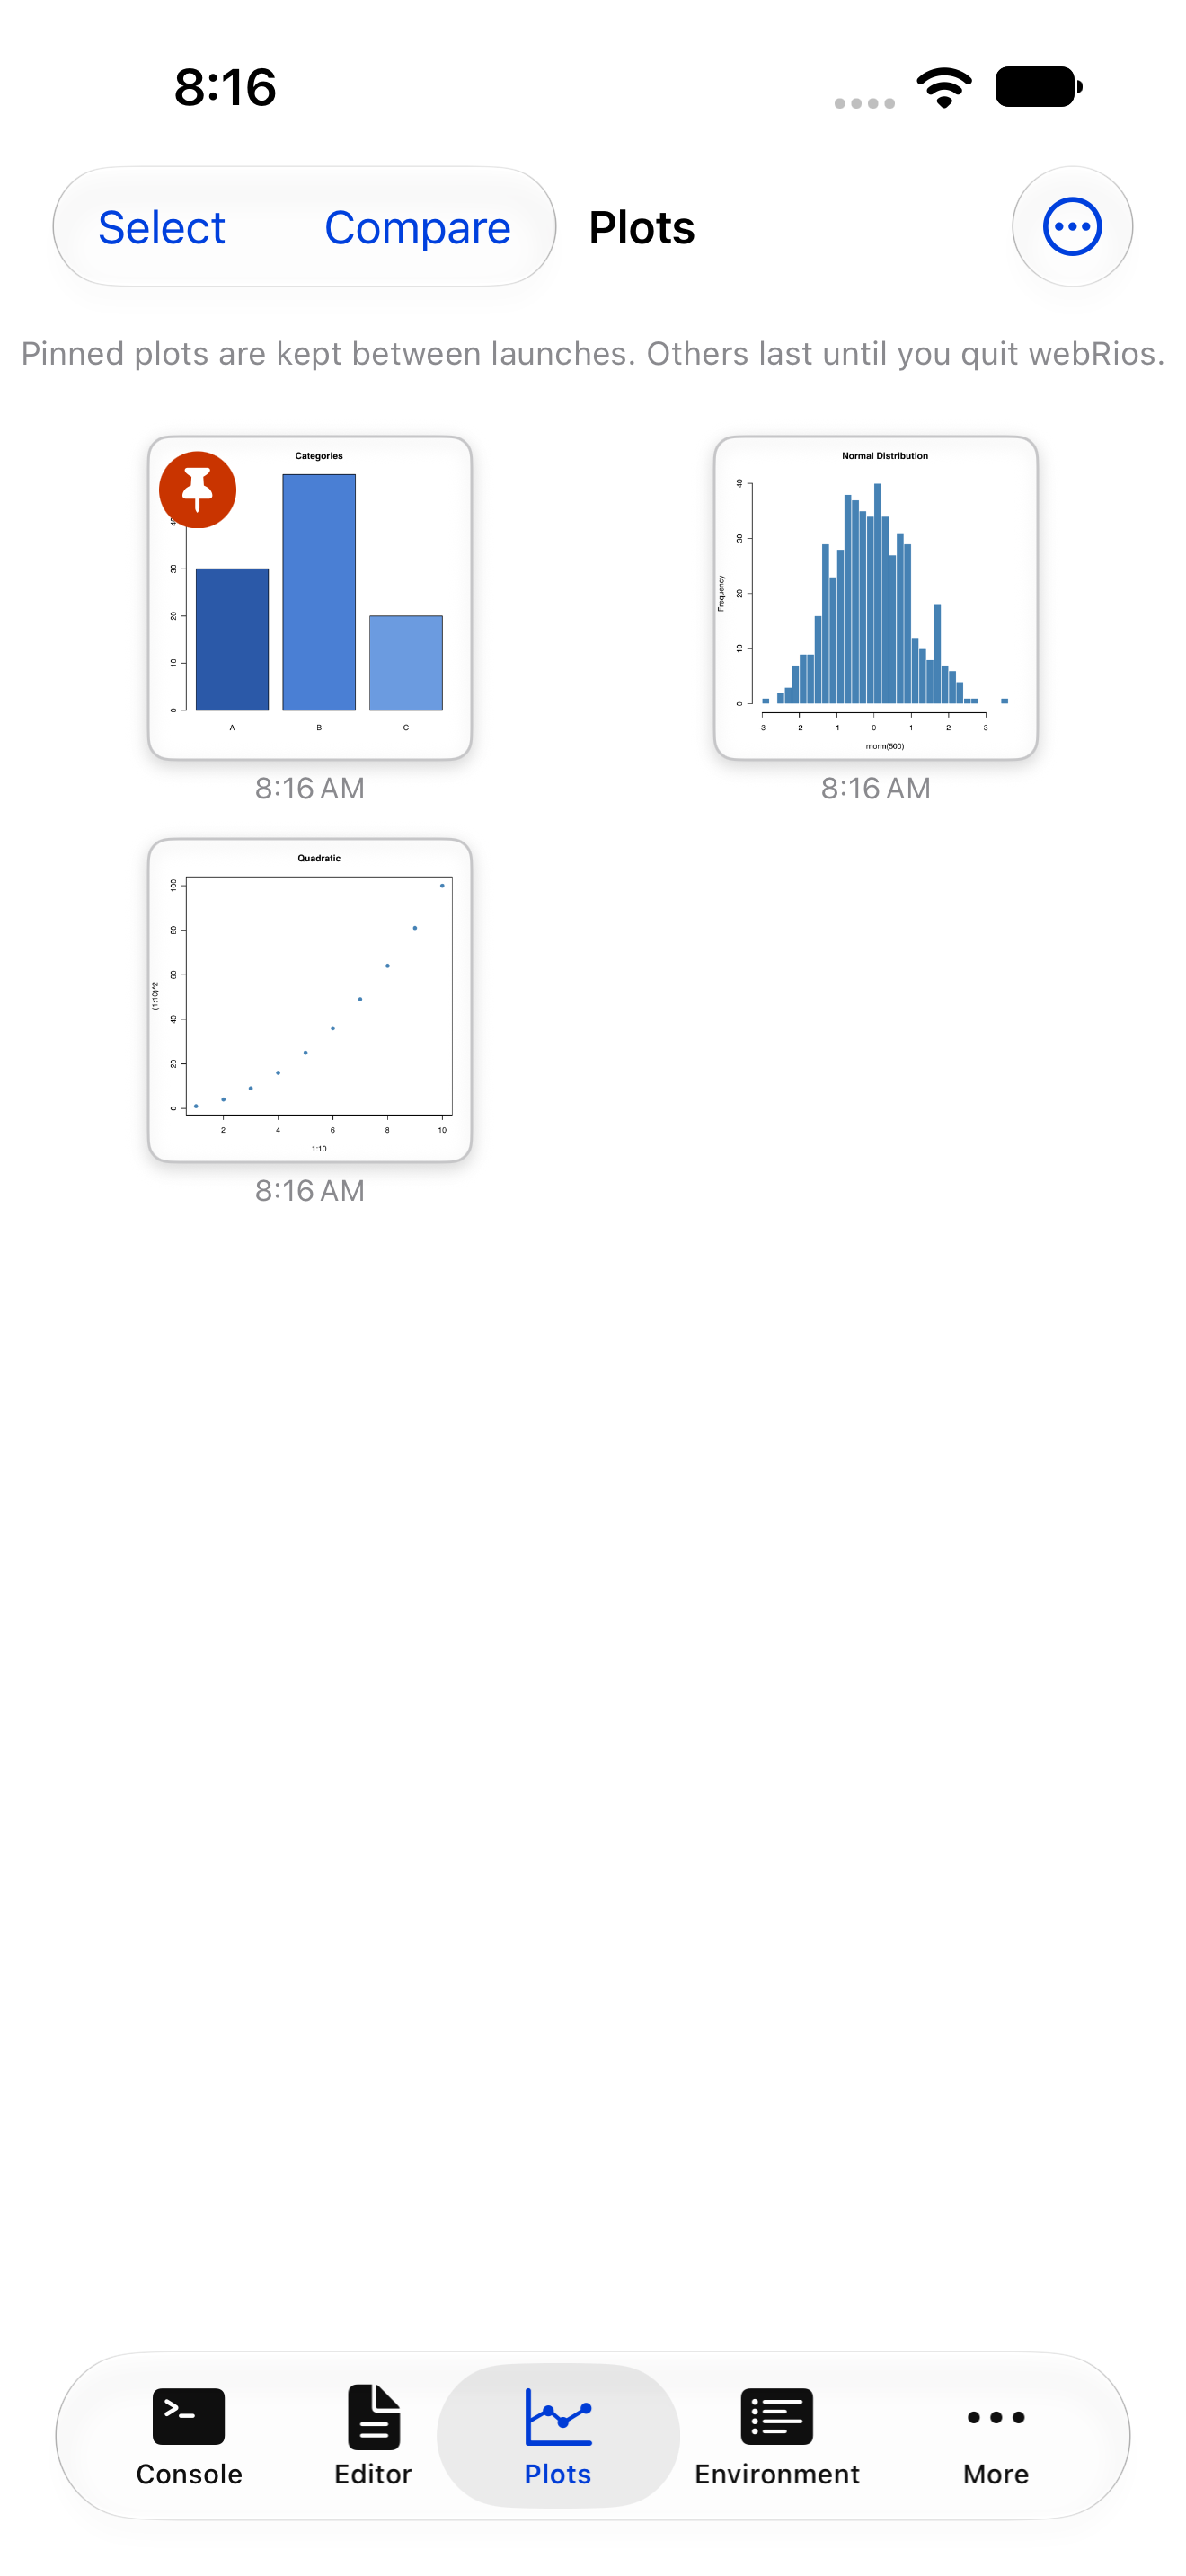
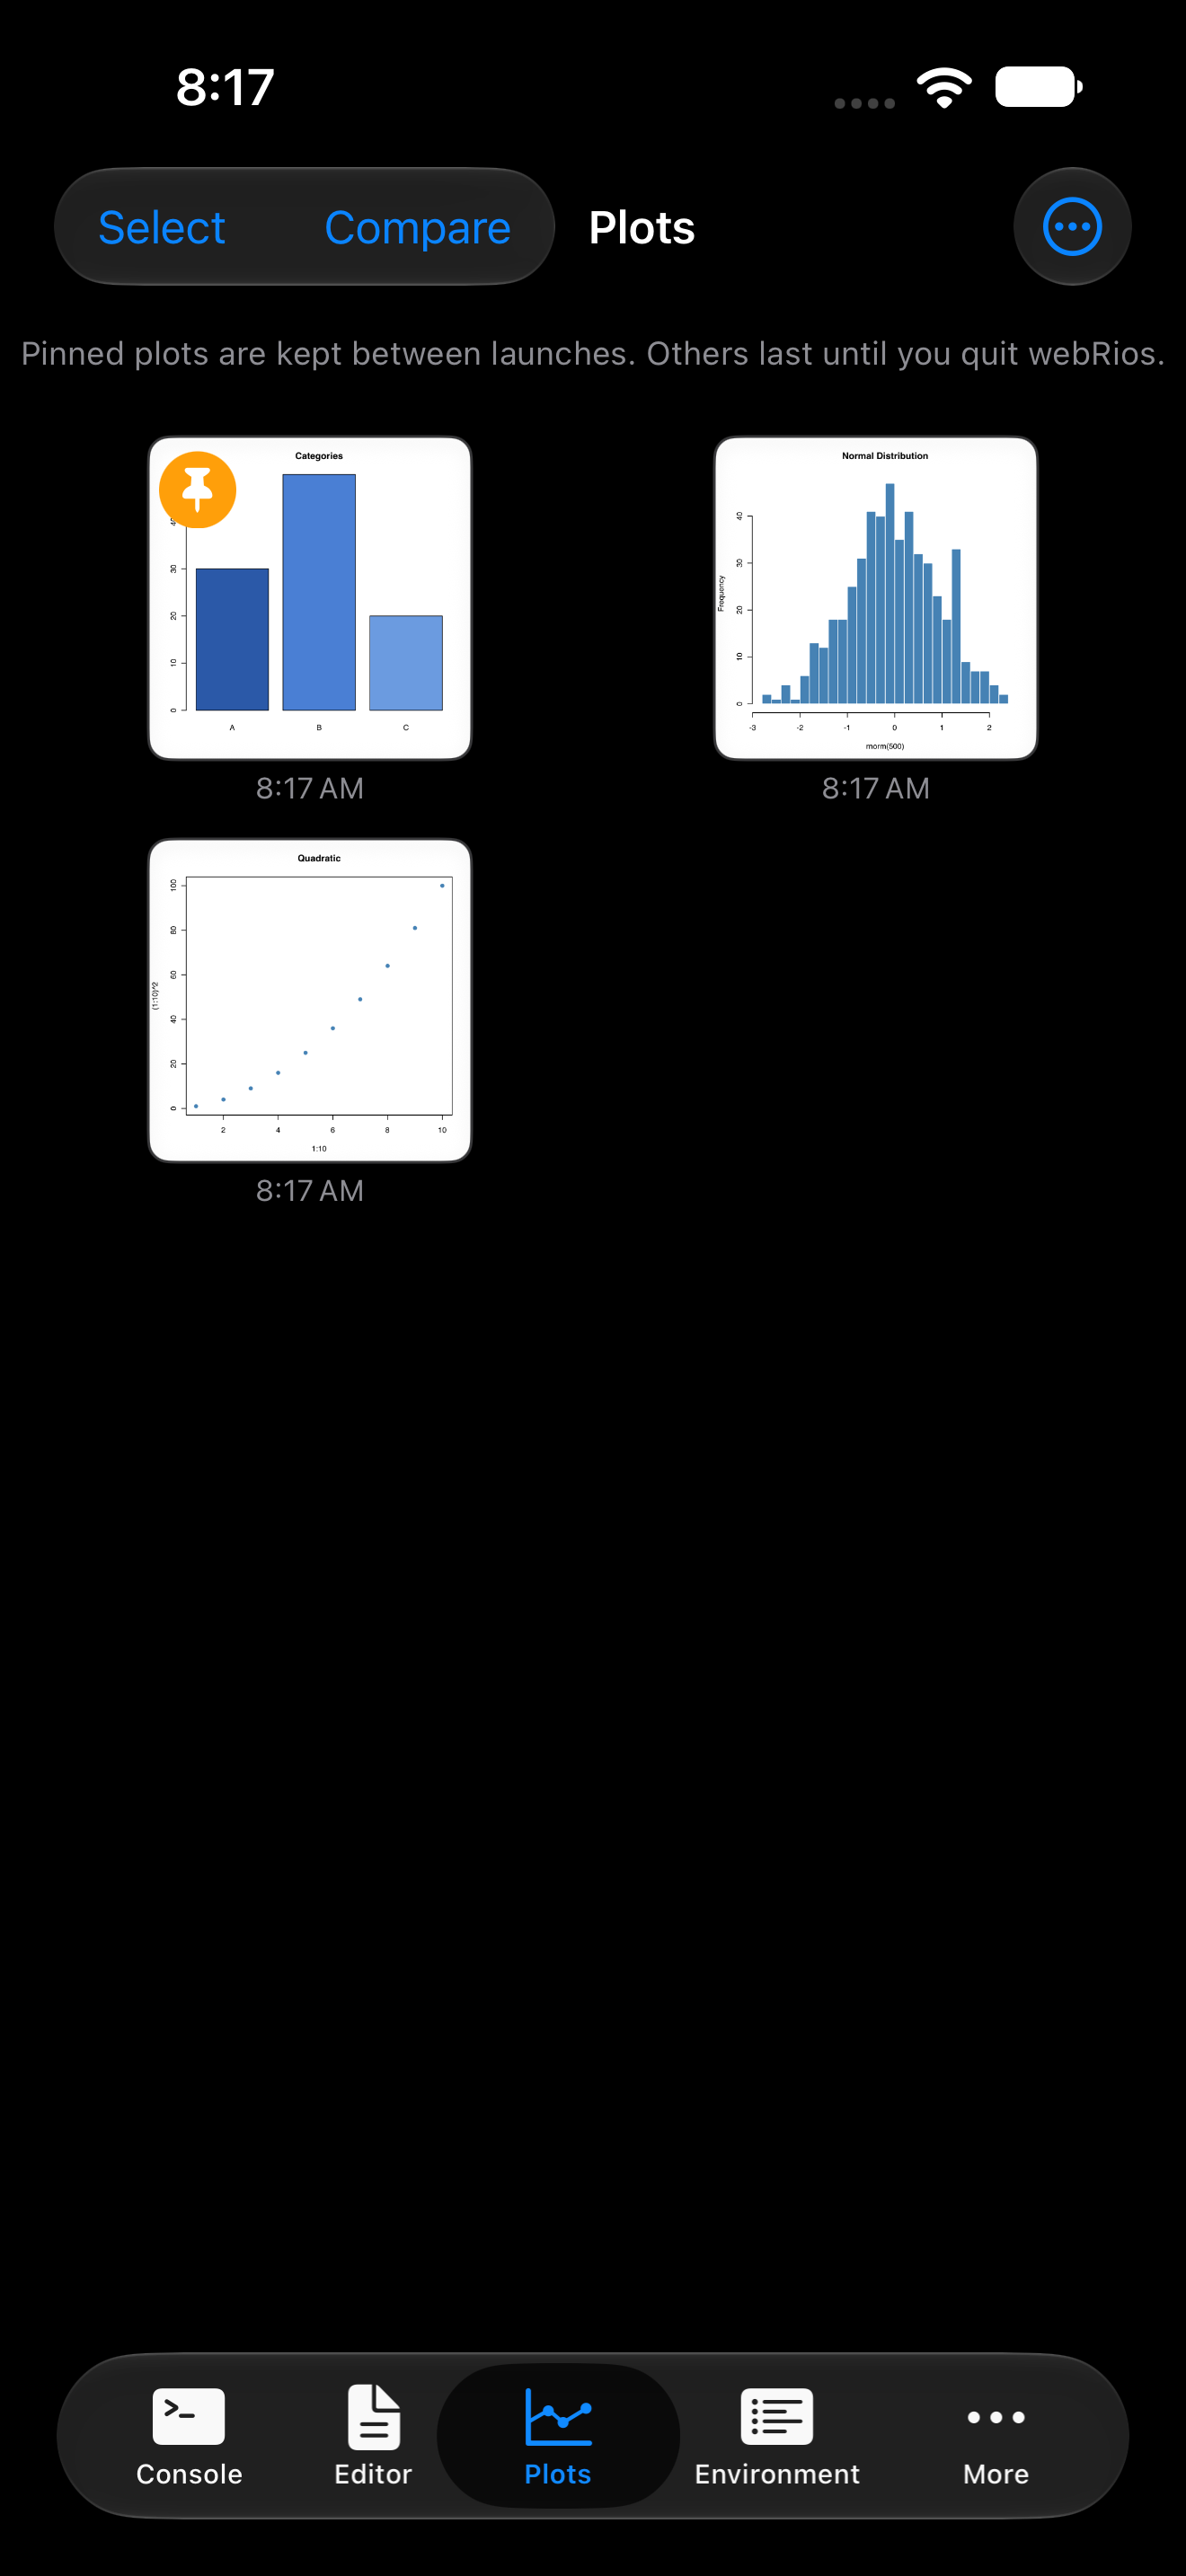
Long-press a thumbnail and choose Pin to protect a plot. Pinned plots show an orange badge, must be unpinned before they can be removed, and survive a relaunch.
You can pin up to 20. A 21st asks you to unpin one (“Pin Limit Reached”). Pins don’t take room from new plots, since the gallery also keeps your 20 newest unpinned ones.
Exporting Plots
There are two ways to get plots out of the app.
Quick share. Tap the share button in the detail view to use the iOS share sheet (Photos, AirDrop, clipboard, etc.). Plots go at full size as PNG. Saving to Photos asks only to add images. webRios never reads your library.
File export. Tap the export button (download icon) in the detail view. You can:
- Choose a filename
- Pick PNG (lossless, supports transparency), JPEG (smaller files) or PDF (vector container, good for printing and papers)
- Save to any location via the iOS file picker, including iCloud Drive, external drives, or other cloud storage
Tapping Save opens the iOS file picker, where you choose the destination.
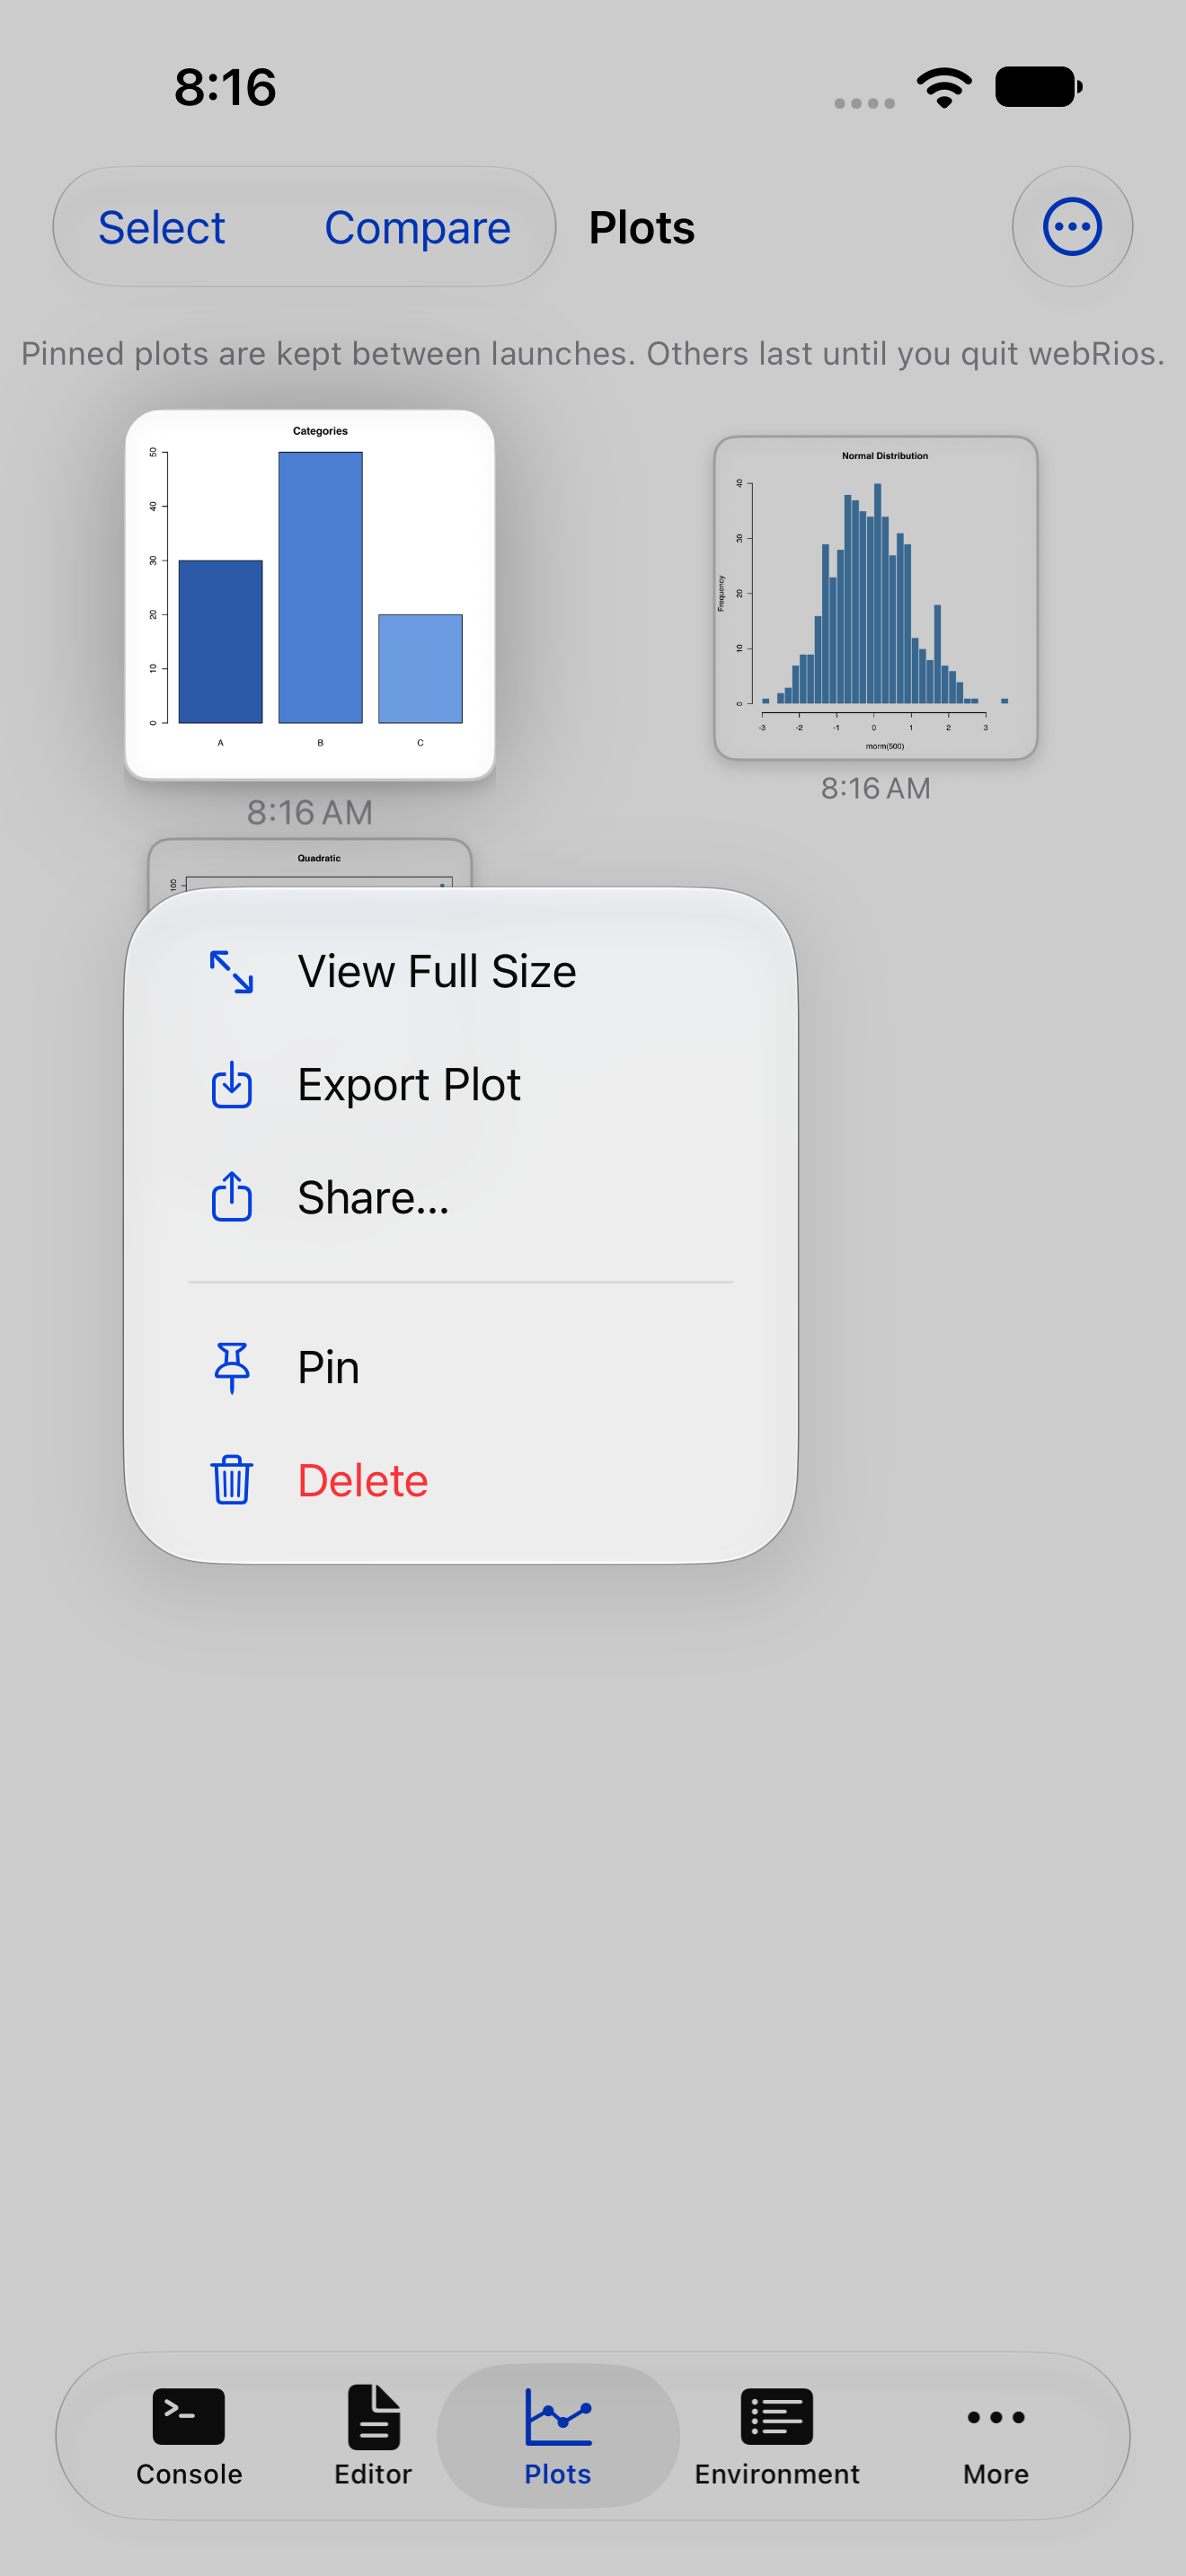
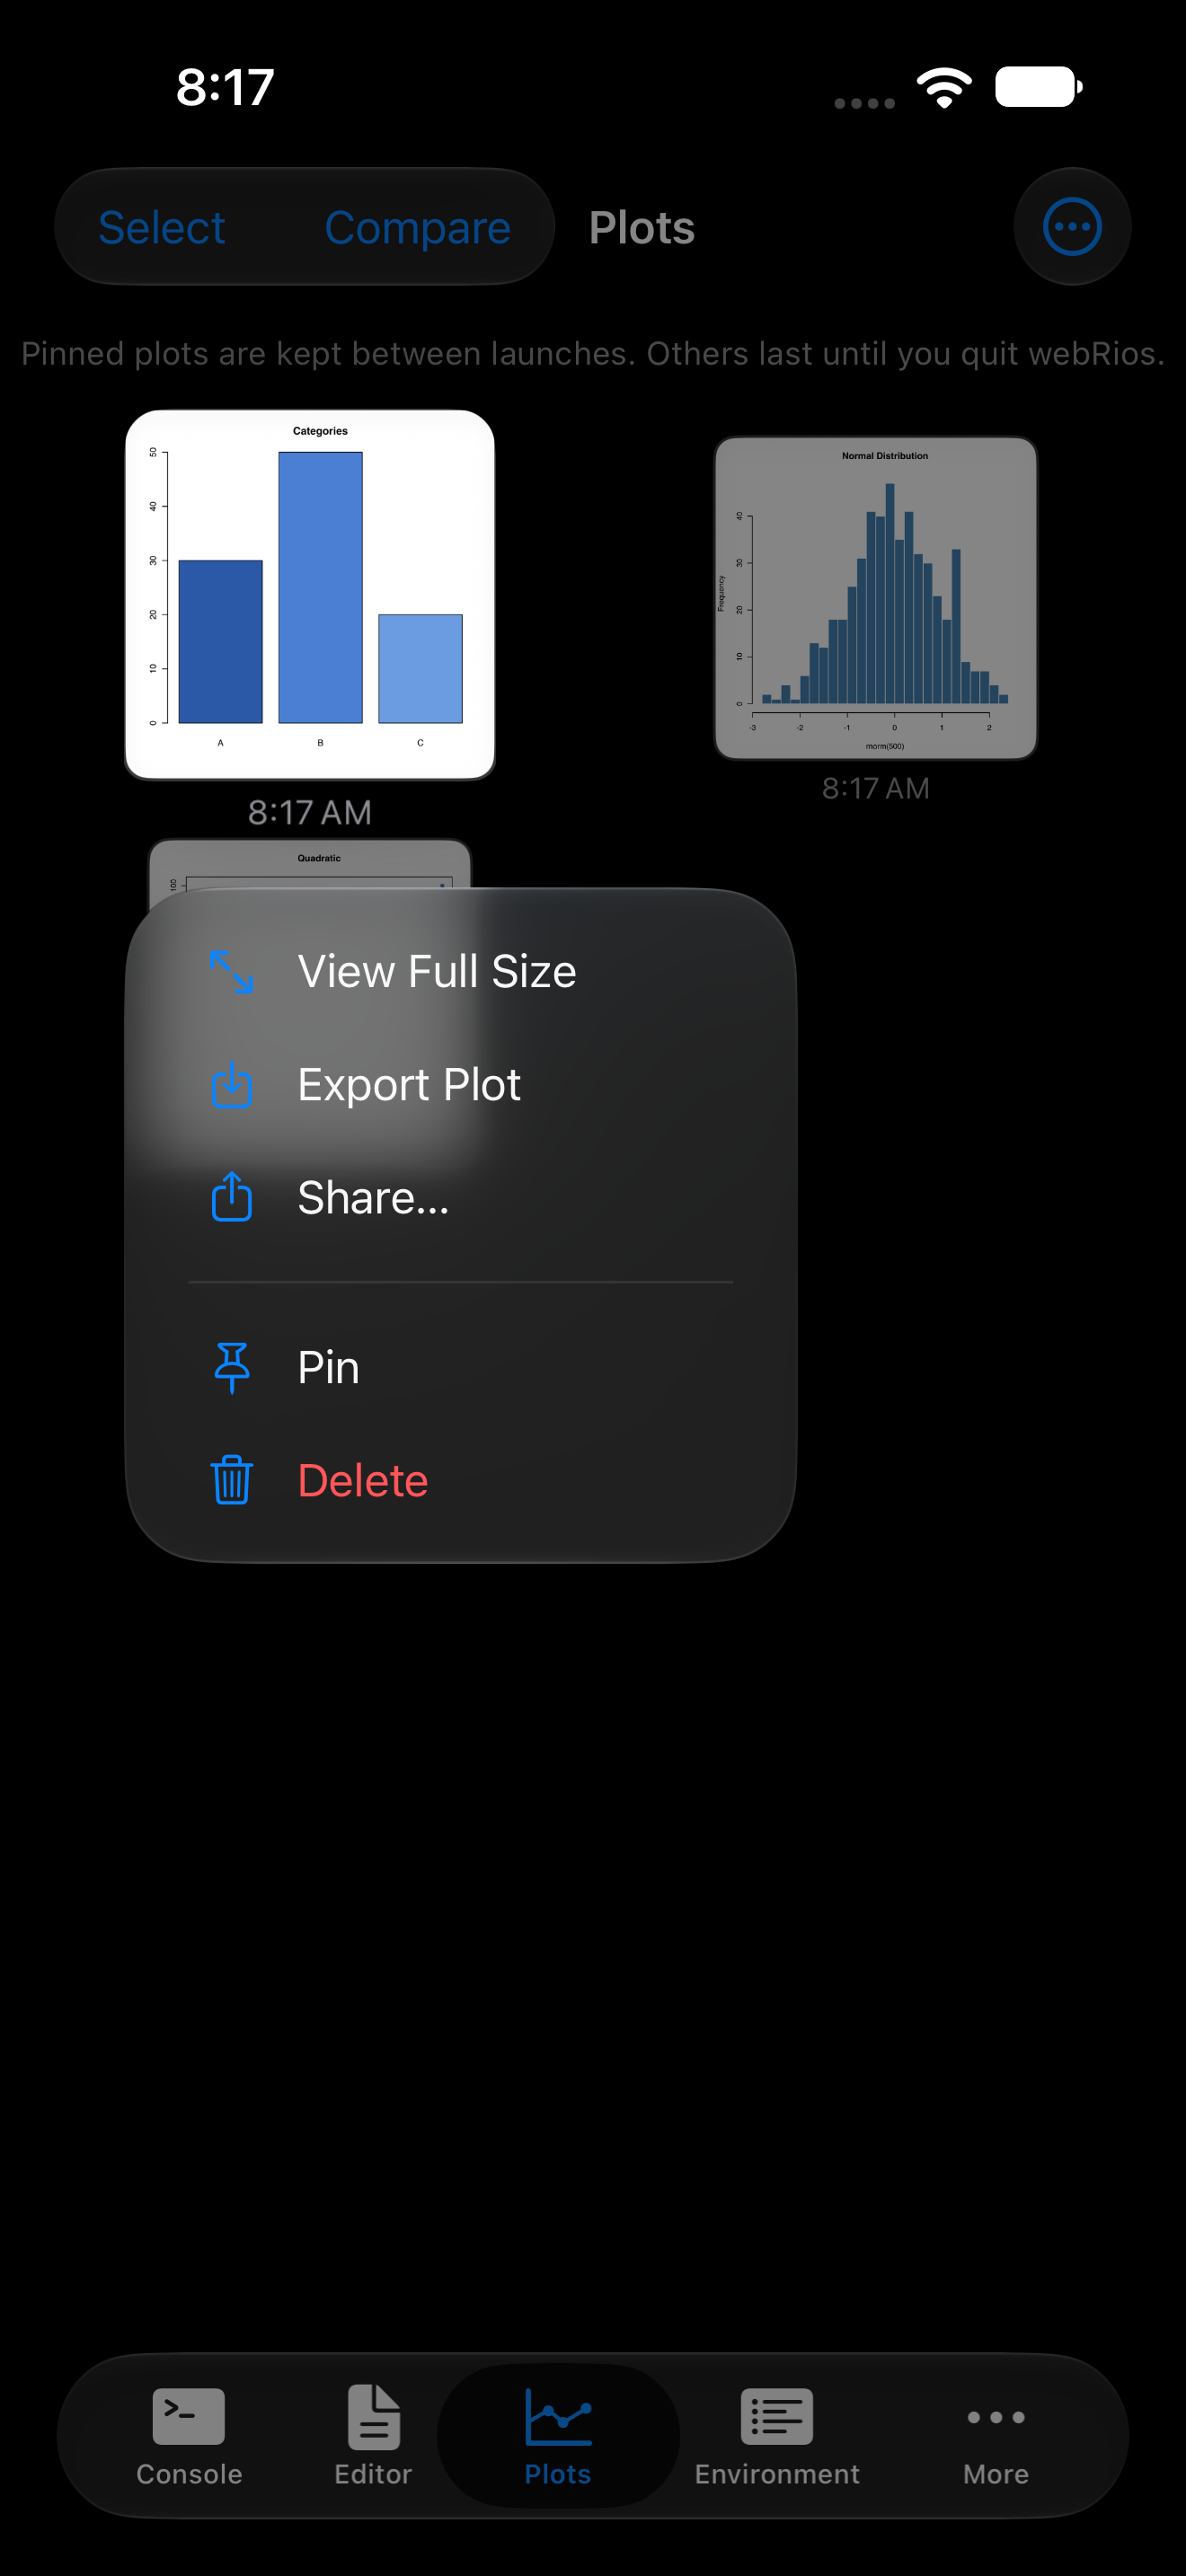
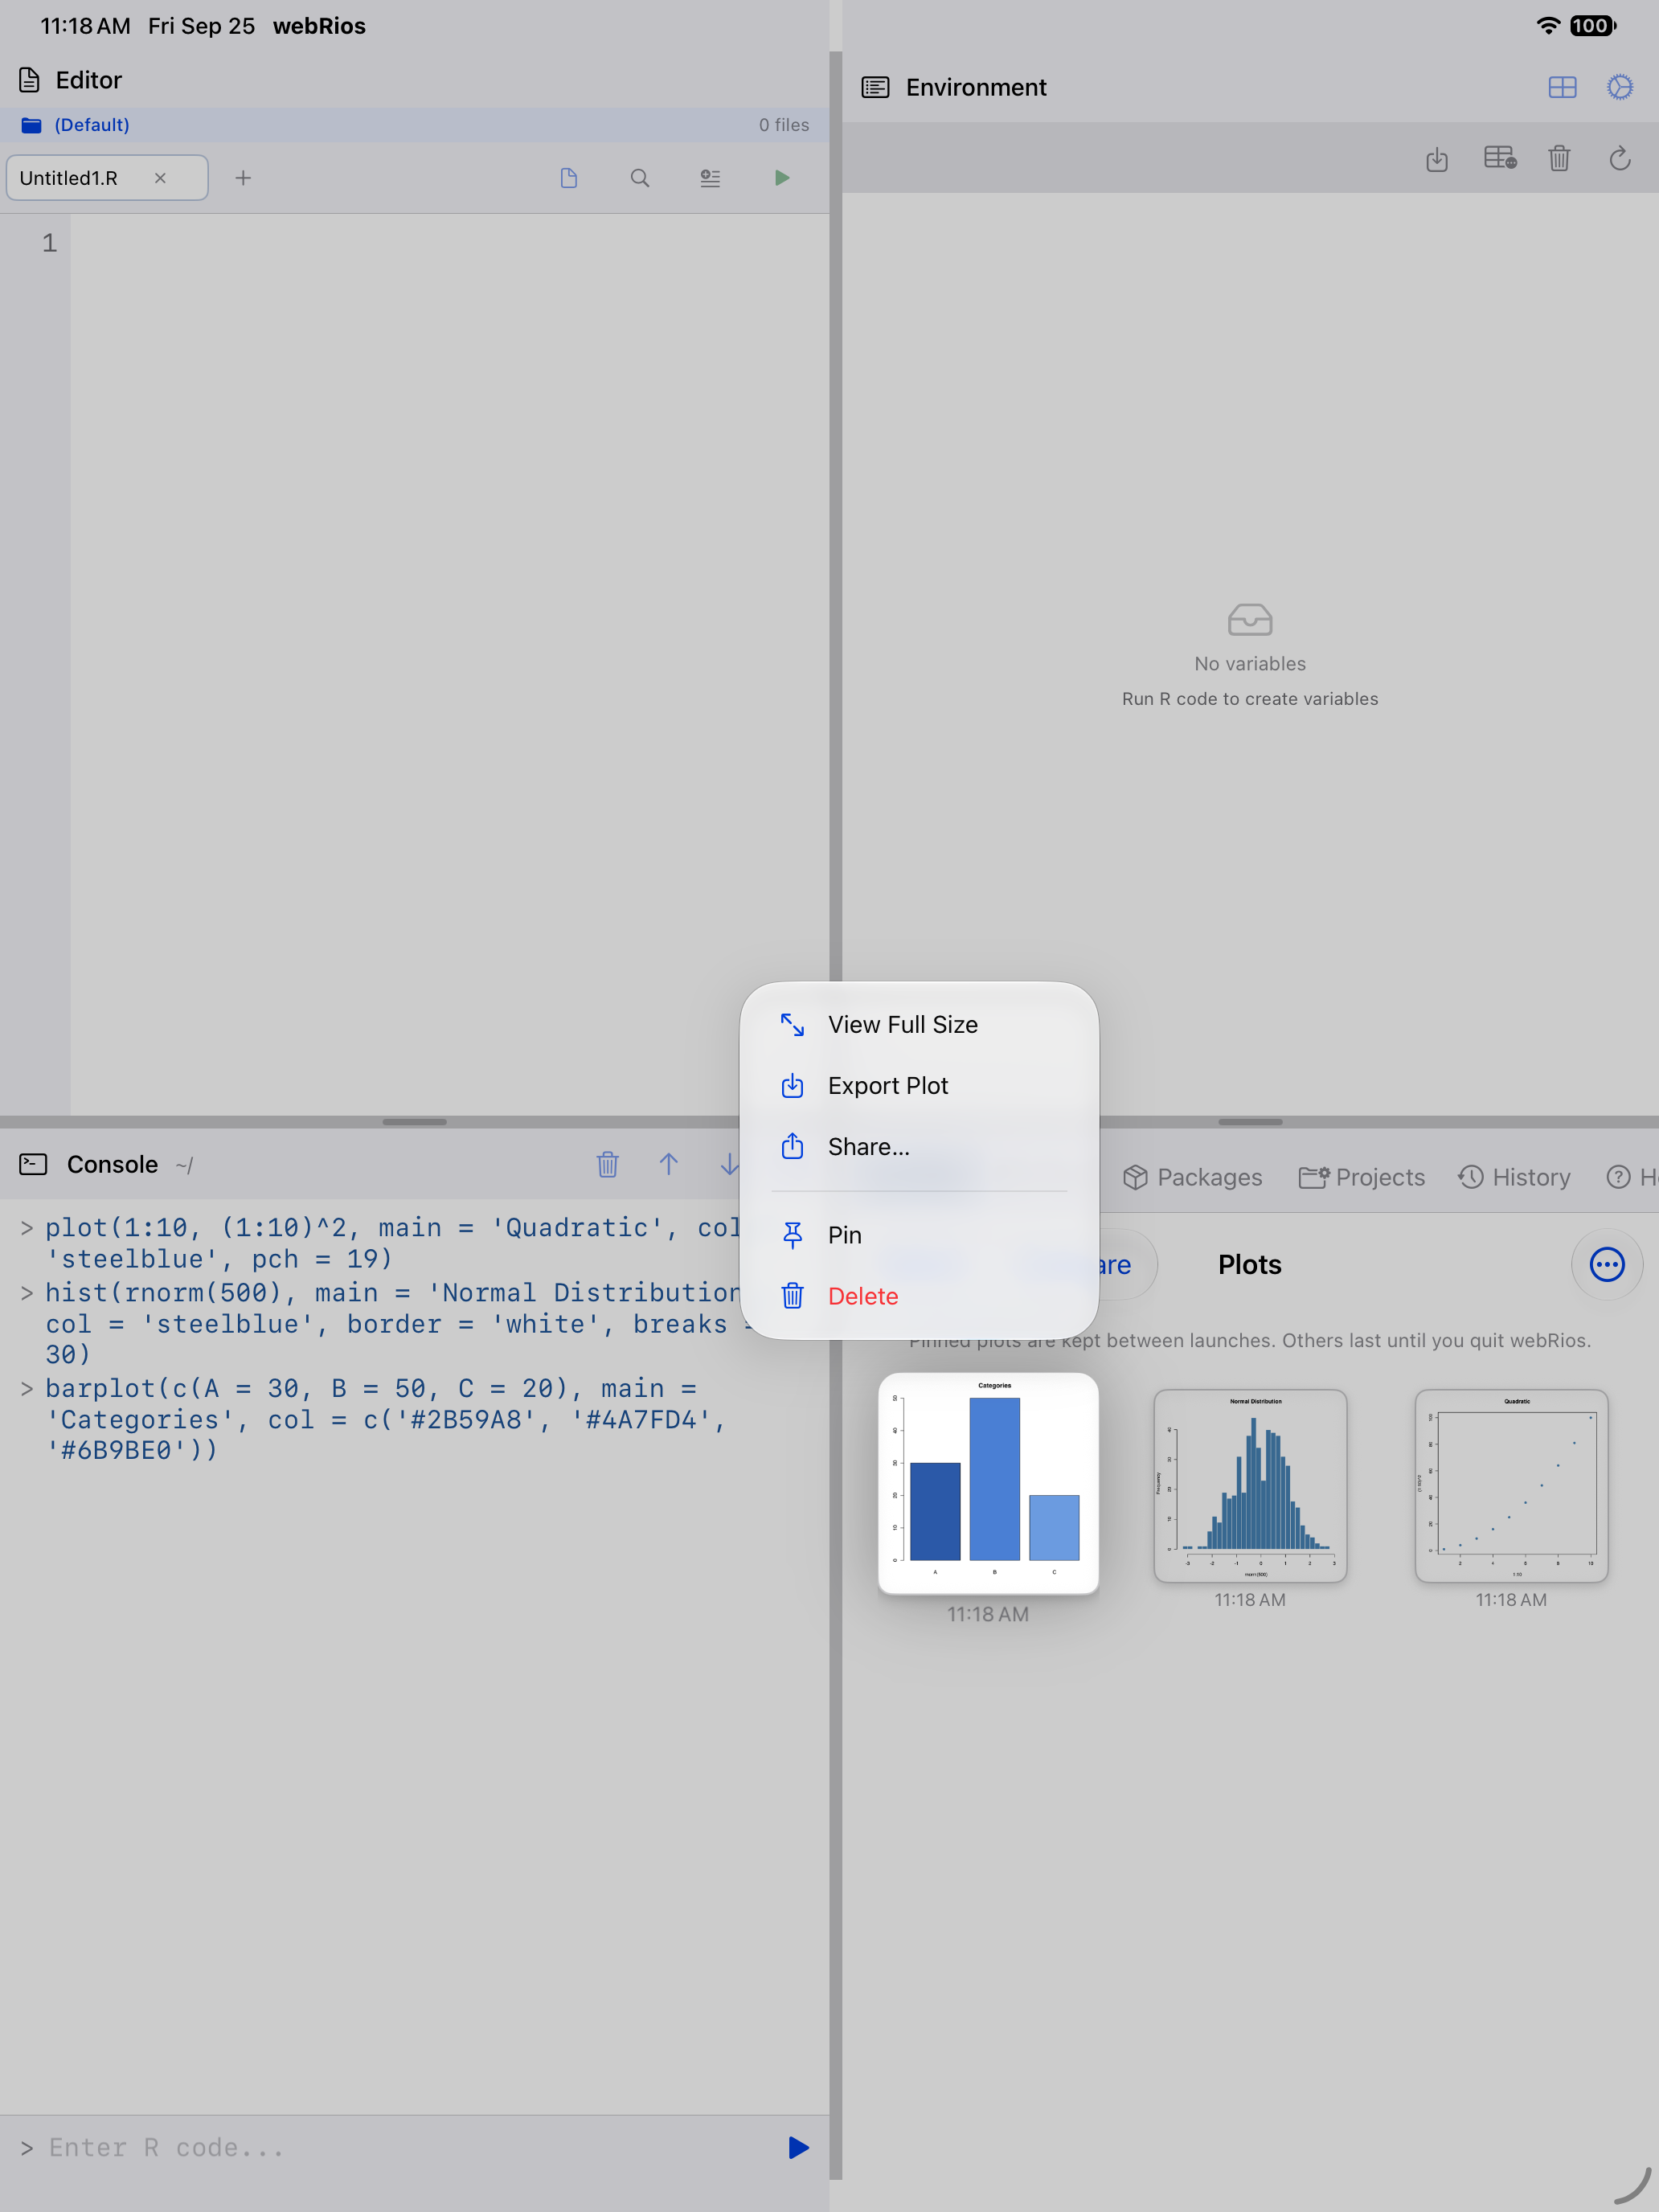
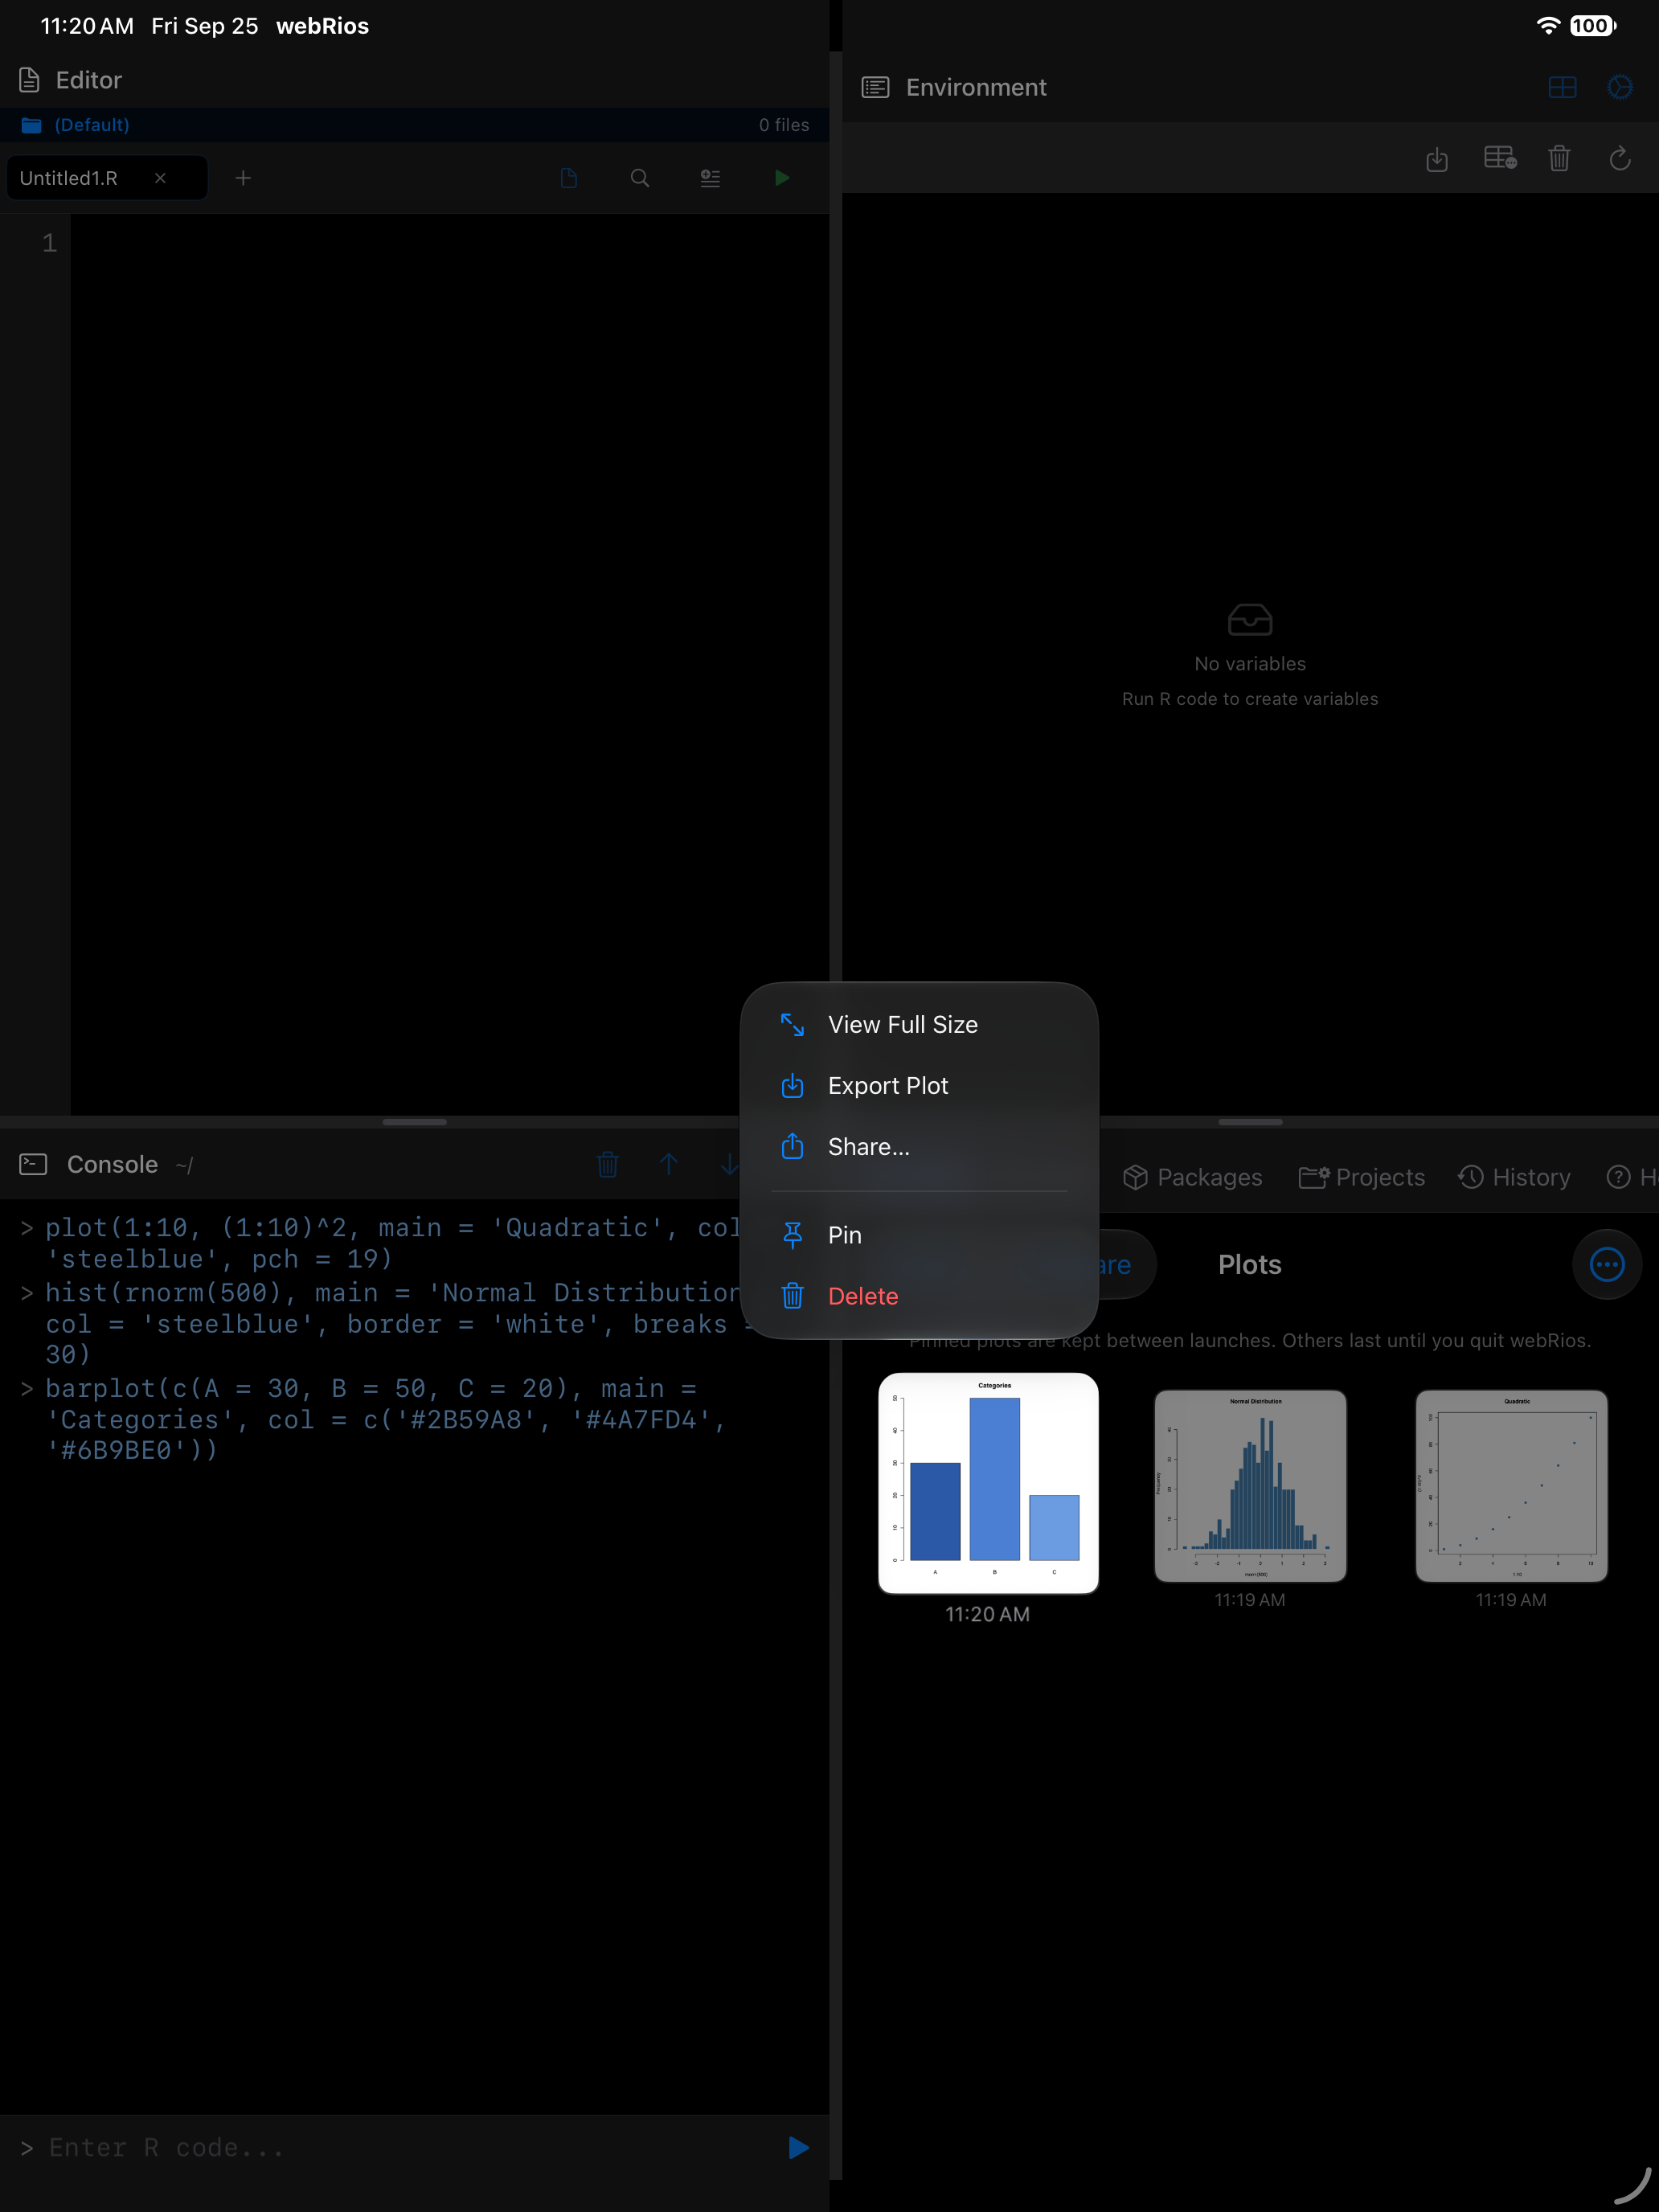
Long-pressing a plot thumbnail in the gallery also gives you a quick Share option without needing to open the detail view first.
A Note on Storage
Pinned plots stay on your device between launches and are included in backups. Other plots last until you quit, and the gallery keeps the 20 newest. Restarting R or a low-memory warning removes nothing. Export or share any plot you want as a file.